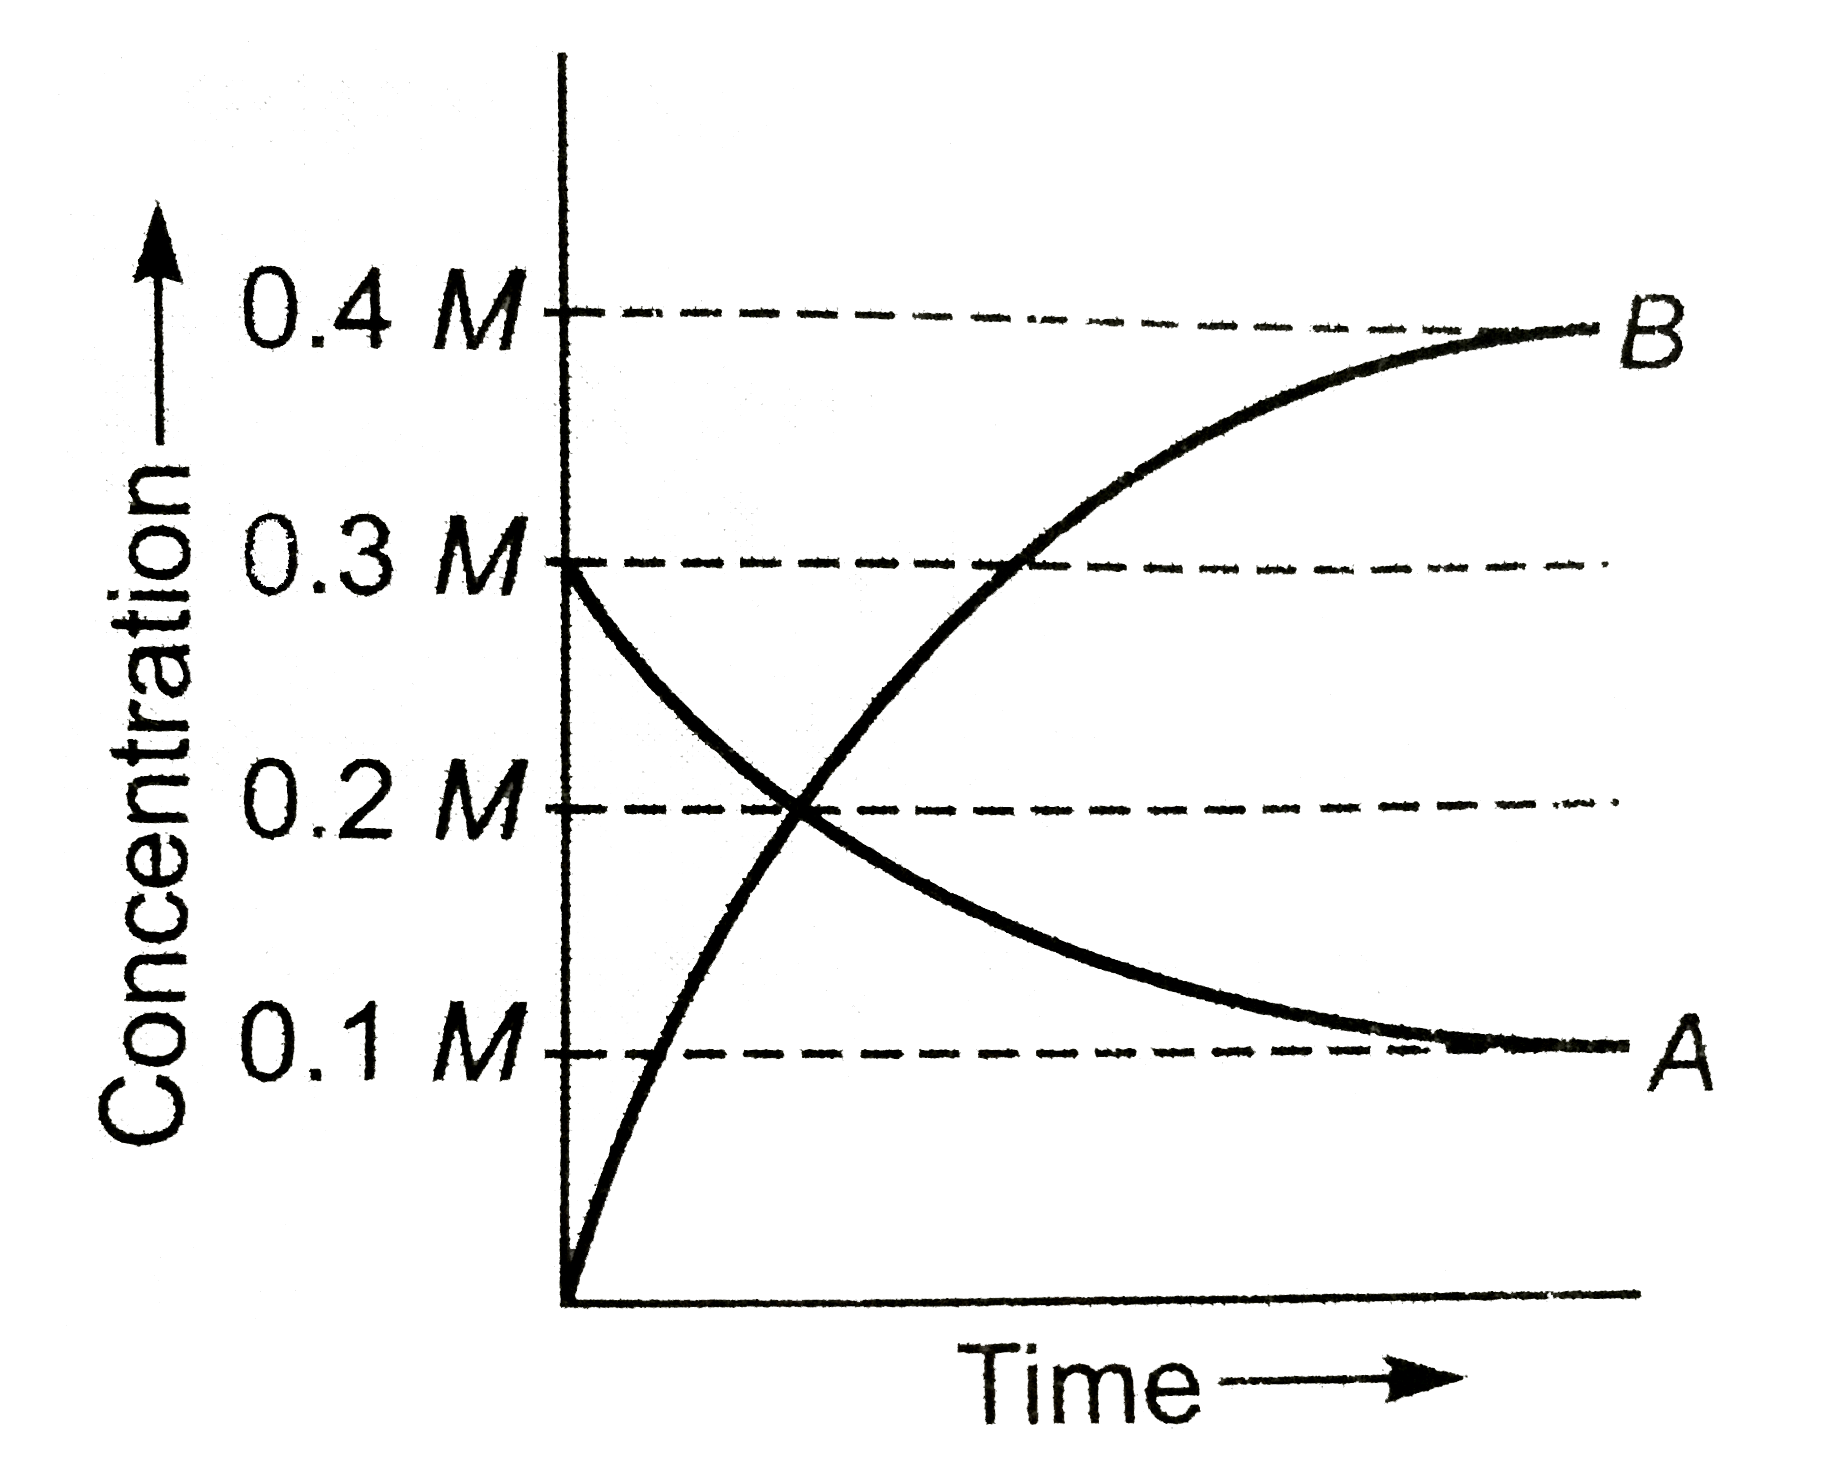
The figure shows the change in concentration of species A and B as a function of time. The equilibrium constant `K_(c)`for the reaction` A(g)hArr2B(g)` is :
A
`K_(c)gt1`
B
`Klt1`
C
`K=1`
D
data insufficient
Text Solution
Verified by Experts
The correct Answer is:
a
Topper's Solved these Questions
CHEMICAL EQUILIBRIUM
NARENDRA AWASTHI|Exercise Level 1 (Q.93 To Q.122)|1 Videos
CHEMICAL EQUILIBRIUM
NARENDRA AWASTHI|Exercise Level 2|1 Videos
ATOMIC STUCTURE
NARENDRA AWASTHI|Exercise Exercise|273 Videos
DILUTE SOLUTION
NARENDRA AWASTHI|Exercise Level 3 - Match The Column|1 Videos
Similar Questions
Explore conceptually related problems
The equilibrium constant K_(p) for the reaction H_(2)(g)+I_(2)(g) hArr 2HI(g) changes if:
The unit of equilibrium constant K_(c) for the reaction A+B hArr C would be
The factor which changes equilibrium constant of the reaction A_(2)(g)+B_(2)(g) rarr 2AB(g) is
Given the mathematical expression for the equilibrium constant K_c for the reaction. 2SO_3(g) hArr 2SO_2(g)+O_2(g)
In a chemical reaction , A+2Boverset(K)hArr2c+D, the initial concentration of B was 1.5 times of the concentrations of A , but the equilibrium concentrations of A and B were found to be equal . The equilibrium constant (K) for the aforesaid chemical reaction is :
The relation between K_(P) and K_(C) for the reaction A(g)+B(g) hArr C(g)+2D(g) is -
The reaction, 2A(g) + B(g)hArr3C(g) + D(g) is begun with the concentration of A and B both at an intial value of 1.00 M. When equilibrium is reached, the concentration of D is measured and found to be 0.25 M. The value for the equilibrium constant for this reaction is given by the expression:
For the reaction, A(g)+2B(g)hArr2C(g) one mole of A and 1.5 mol of B are taken in a 2.0 L vessel. At equilibrium, the concentration of C was found to be 0.35 M. The equilibrium constant (K_(c)) of the reaction would be