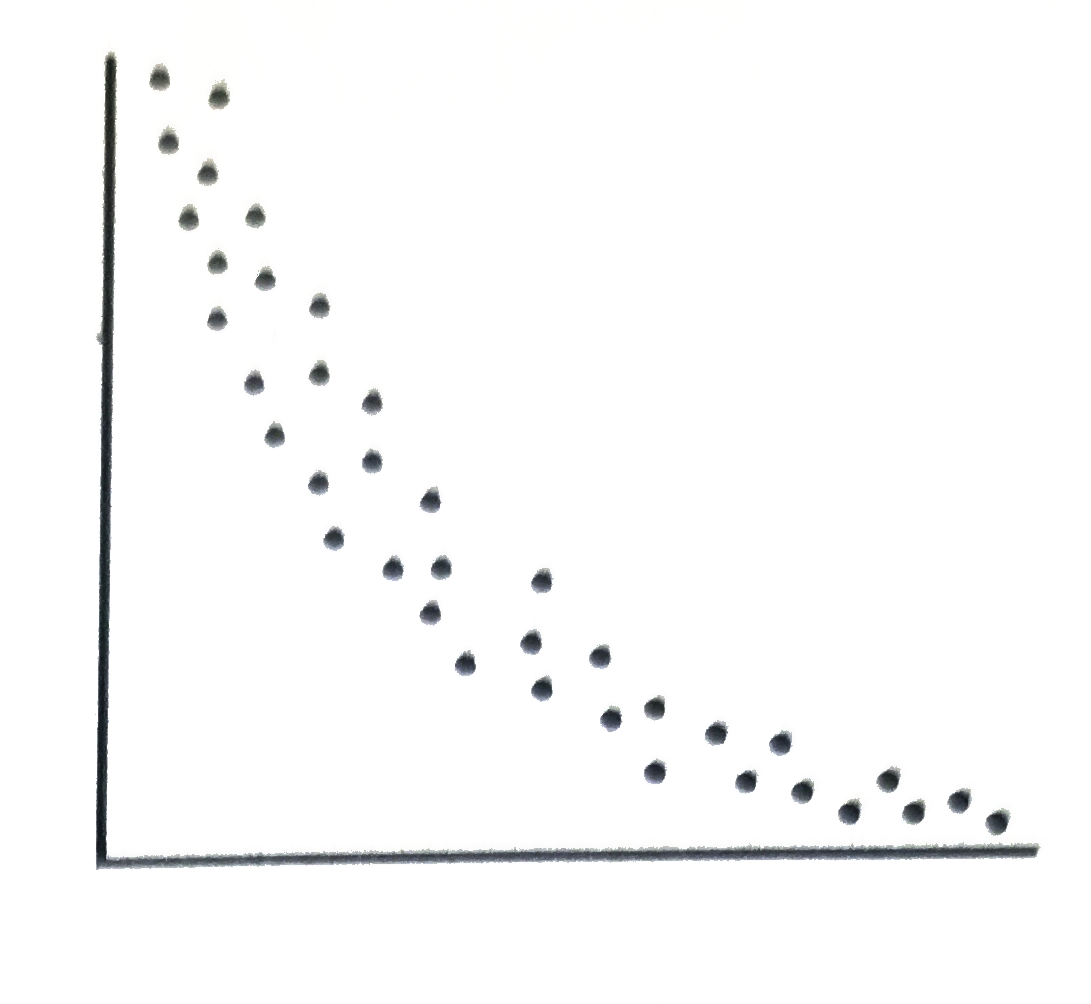
A
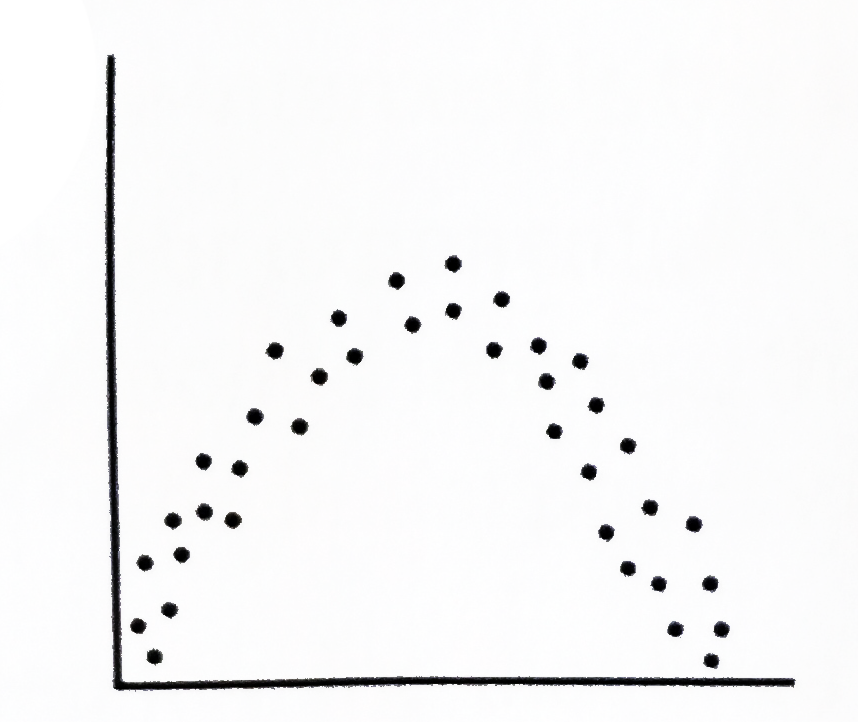
B
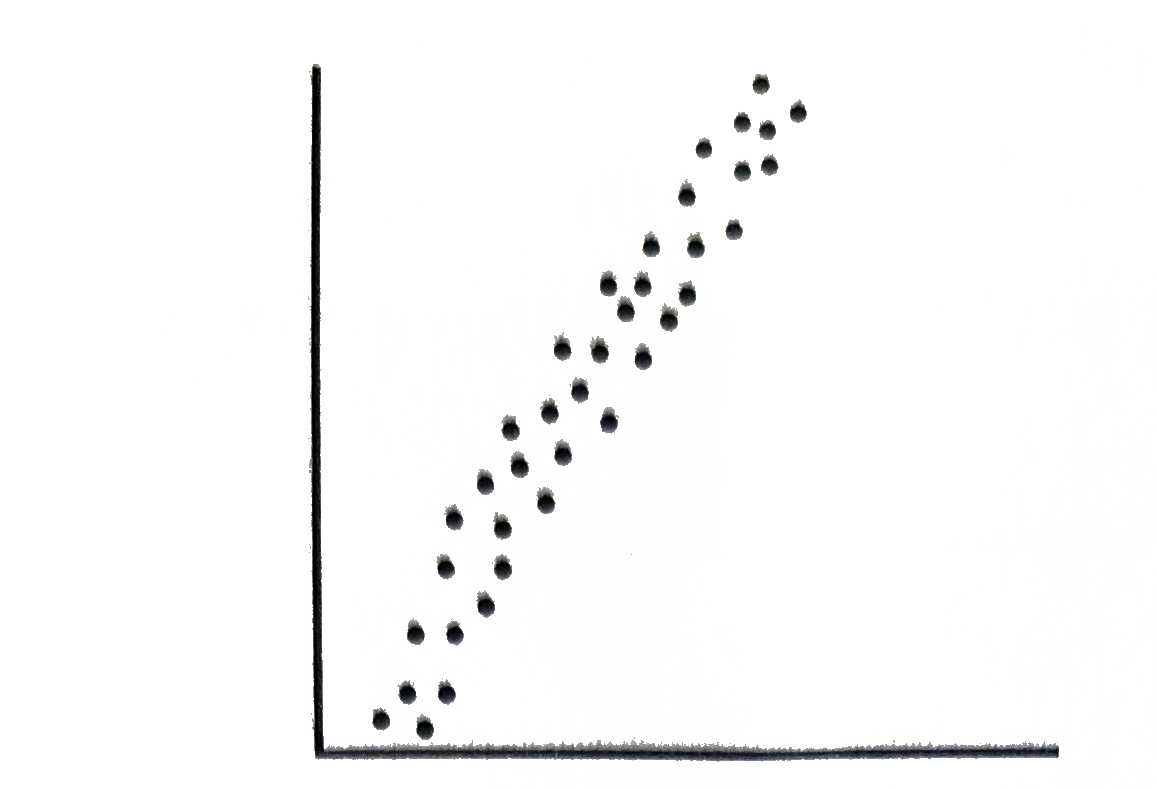
C
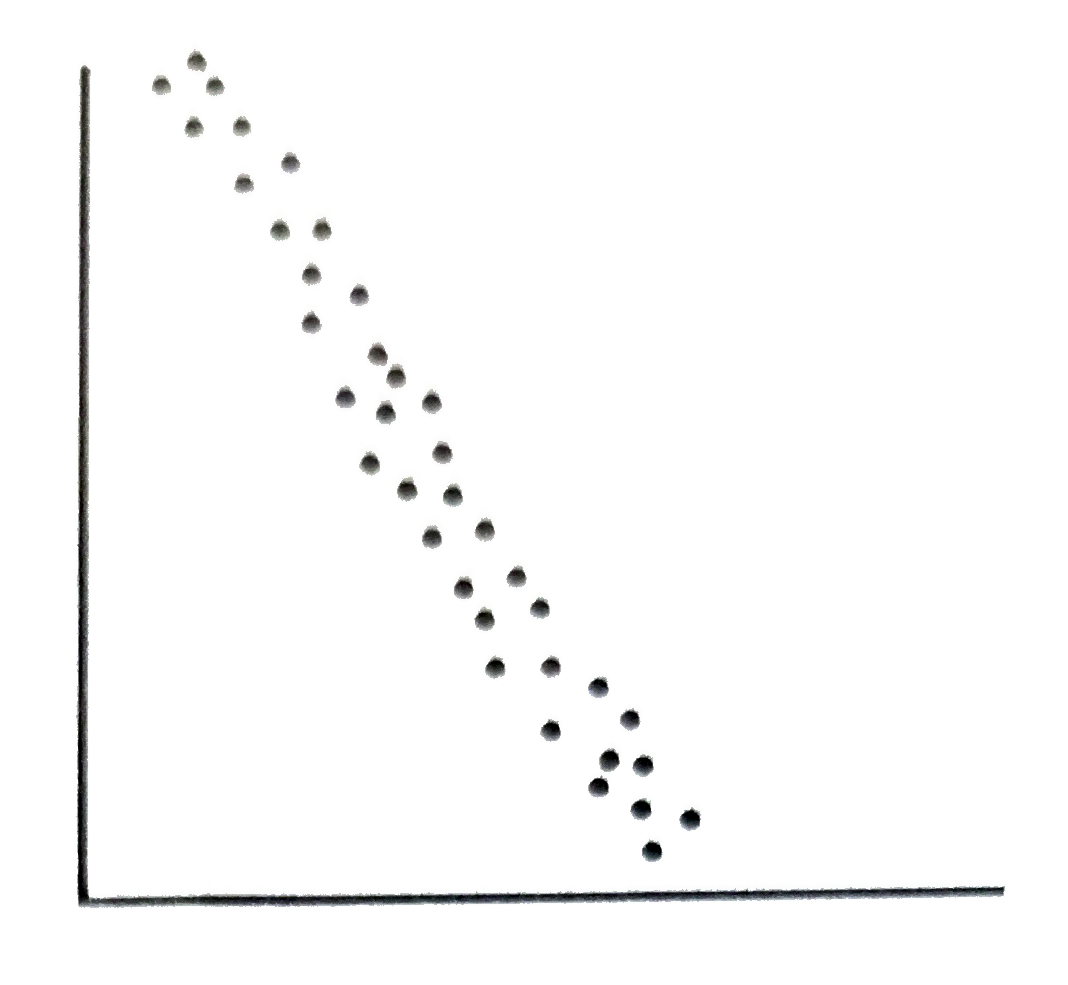
D
Text Solution
Verified by Experts
The correct Answer is:


Topper's Solved these Questions
SCATTERPLOTS
KAPLAN|Exercise LINE OF BEST FIT|1 VideosSCATTERPLOTS
KAPLAN|Exercise SCATTERPLOT MODELING|1 VideosSCATTERPLOTS
KAPLAN|Exercise SCATTERPLOT MODELING|1 VideosSAT MATH: TIMING ANS SECTION MANAGEMENT STRATEGIES
KAPLAN|Exercise TRY ON YOU OWN|5 VideosSYSTEMS OF LINEAR EQUATIONS
KAPLAN|Exercise NUMBER OF POSSIBLE SOLUTIONS|1 Videos
Similar Questions
Explore conceptually related problems
KAPLAN-SCATTERPLOTS-TRY ON YOUR OWN
- Most chickens reach maturity and begin laying eggs at around 20 weeks ...
Text Solution
|
- Most chickens reach maturity and begin laying eggs at around 20 weeks ...
Text Solution
|
- The scatterplot above shows the number of minor muscle strain injuries...
Text Solution
|
- The graph above shows the percent of school-age children in the United...
Text Solution
|
- A car manufacture compiled data that indicated gas mileage decreased a...
Text Solution
|
- Which of the following is best modeled using a linear regression equat...
Text Solution
|
- Adriana used the data from a scatterplot she found on the U.S. Census ...
Text Solution
|
- Suppose a scatterplot shows a weak negative linear coorelation. Which ...
Text Solution
|
- A drain at the bottom of a cylondrical water tank is opened and the he...
Text Solution
|
- Student in a finance class surveyed 20 percent of the account holders...
Text Solution
|
- The Human Resources department of a company tracks employee sick day u...
Text Solution
|
- Scientists plotted data for two animal populations on a scatterplot: p...
Text Solution
|
- By what percent does the y-coordinate of the data point (12,12) deviat...
Text Solution
|
- The scatterplot below compares the average gasoline prices I Boston, p...
Text Solution
|
- A physicas professor presented the scatterplot above to her first-year...
Text Solution
|
- Which of the following is the most accurate statement about the scatte...
Text Solution
|
- Tioga Road is a mountain pass that crosses the Sierra nevada through n...
Text Solution
|
- Tioga Road is a mountain pass that crosses the Sierra nevada through n...
Text Solution
|
- Which of the following scatterplots shows a ralationship that is appro...
Text Solution
|
- The scatterplot above shows the actual and estimated number of custome...
Text Solution
|