A
B
C
D
Text Solution
Verified by Experts
The correct Answer is:


Topper's Solved these Questions
Similar Questions
Explore conceptually related problems
BITSAT GUIDE-PHYSICS FOR GASEOUS STATE-BITSAT Archives
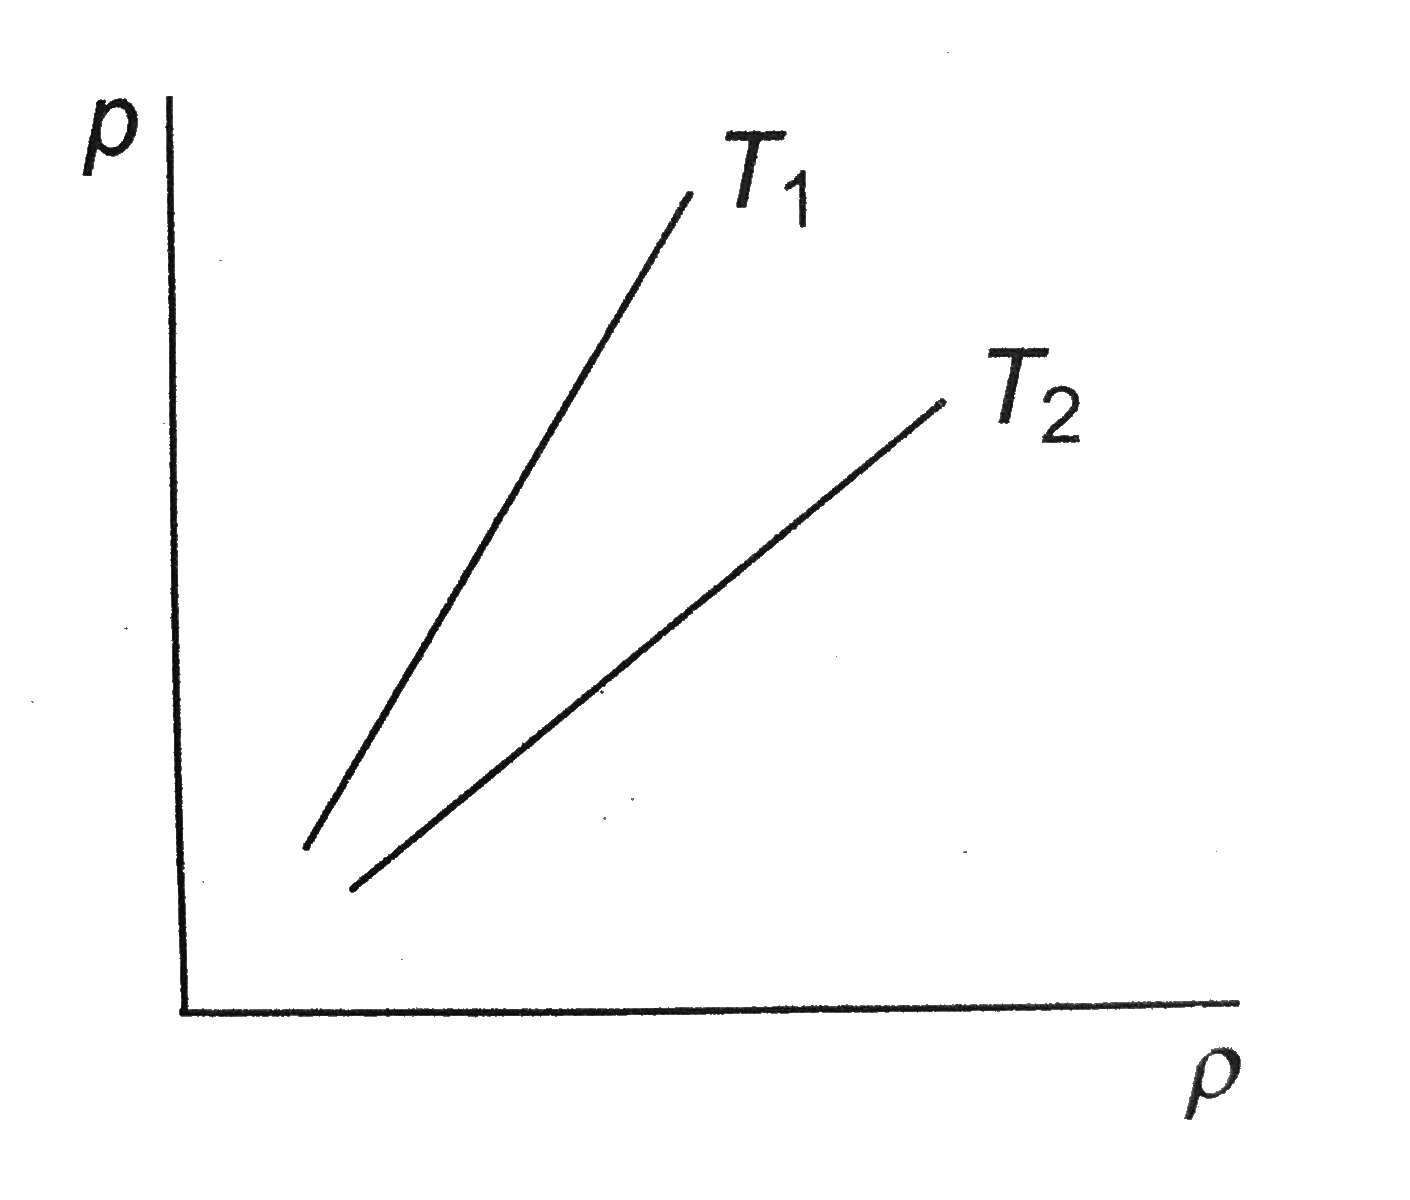
- Figure shows graphs of pressure vs density for an ideal gas at two tem...
Text Solution
|
- Two ballons are filled, one with pure He gas and other by air, repecti...
Text Solution
|
- A vessel containing 1 mole of O(2) gas (molar mass 32) at tempeature T...
Text Solution
|
- The temperature of an ideal gas is increased from 27^(@)C to 127^(@)C,...
Text Solution
|
- The ratio of the adiabatic bulk modulus to the isothermal bulk modulus...
Text Solution
|
- If V is the molecular speed and / is the mean free path of molecule of...
Text Solution
|
- From the following V-T diagram, what is true about pressure?" ...
Text Solution
|
- One litre of oxygen at a pressure of 1 atm and two litres of nitrogen ...
Text Solution
|
- The ratio of velocity of sound in hydrogen and oxygen at STP is " ...
Text Solution
|