Text Solution
Verified by Experts


Topper's Solved these Questions
KINETIC THEORY
SUBHASH PUBLICATION|Exercise THREE MARK QUESTION AND ANSWERS|3 VideosKINETIC THEORY
SUBHASH PUBLICATION|Exercise FIVEMARK QUESTION AND ANSWERS|4 VideosKINETIC THEORY
SUBHASH PUBLICATION|Exercise NUMERICALS WITH SOLUTIONS|19 VideosGRAVITATION
SUBHASH PUBLICATION|Exercise NUMERICALS WITH SOLUTIONS|15 VideosLAWS OF MOTION
SUBHASH PUBLICATION|Exercise Numericals with solutions|15 Videos
Similar Questions
Explore conceptually related problems
SUBHASH PUBLICATION-KINETIC THEORY-TWO MARK QUESTION AND ANSWERS
- Give the expression for the average kinetic energy of a molecule.
Text Solution
|
- Show that the specific heat capacity of water in terms of universal g...
Text Solution
|
- Obtain the value of specific heat of water in terms of Jkg^(-1)K^(-1).
Text Solution
|
- Give the expression for the vibrational energy of molecules?
Text Solution
|
- Show that specific heat capacity of a solid is equal to three times th...
Text Solution
|
- Draw PV indicator diagram for the ideal and real behaviours of a ga...
Text Solution
|
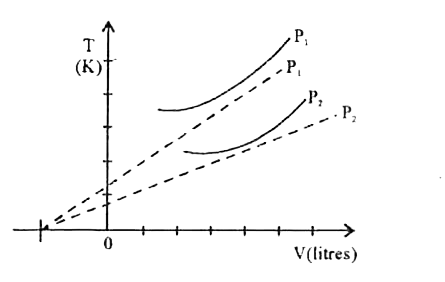
- Draw T-V curves for ideal and real gas behaviours.
Text Solution
|
- Write the expression for pressure exerted by an ideal gas on the walls...
Text Solution
|
- Express average K.E. per molecule of two gaseous mixtures?
Text Solution
|