 .
.A
B
C
D
Text Solution
Verified by Experts
The correct Answer is:


Topper's Solved these Questions
MOTION IN A STRAIGHT LINE
GRB PUBLICATION|Exercise Assertion Reason|12 VideosMOTION IN A STRAIGHT LINE
GRB PUBLICATION|Exercise Matrix -match|4 VideosMOTION IN A STRAIGHT LINE
GRB PUBLICATION|Exercise Objective question|168 VideosFRICTION AND CIRCULAR MOTION
GRB PUBLICATION|Exercise Comprehension type|11 VideosMOTION IN TWO AND THREE DIMENSIONS
GRB PUBLICATION|Exercise All Questions|210 Videos
Similar Questions
Explore conceptually related problems
GRB PUBLICATION-MOTION IN A STRAIGHT LINE-More than one choice is correct
- Which of the following statements about distance are tire?
Text Solution
|
- If a body after travelling some distance comes back to its starting po...
Text Solution
|
- If the velocity of a body is constant:
Text Solution
|
- If a particle travels a linear distance at speed v(1) and comes back a...
Text Solution
|
- For a moving particle, which of the following options may be correct? ...
Text Solution
|
- Which of the following statements are ture?
Text Solution
|
- If a body is accelerating:
Text Solution
|
- If two bodies are in motion with velocity vec(v)(1) and vec(v)(2):
Text Solution
|
- The velocity of a particle is at any time related to the distance trav...
Text Solution
|
- A train accelerating uniformly passes three successive kilometre posts...
Text Solution
|
- Two cities A and B are connected by a regular bus service with buses p...
Text Solution
|
- A carrom striker is given velocity on carrom based has always. Frictio...
Text Solution
|
- For the one dimensional motion, described by x=t-sint
Text Solution
|
- A particle moves along a straight line its velocity dipends on time as...
Text Solution
|
- A particle moves with an initial velocity v(0) and retardation alpha v...
Text Solution
|
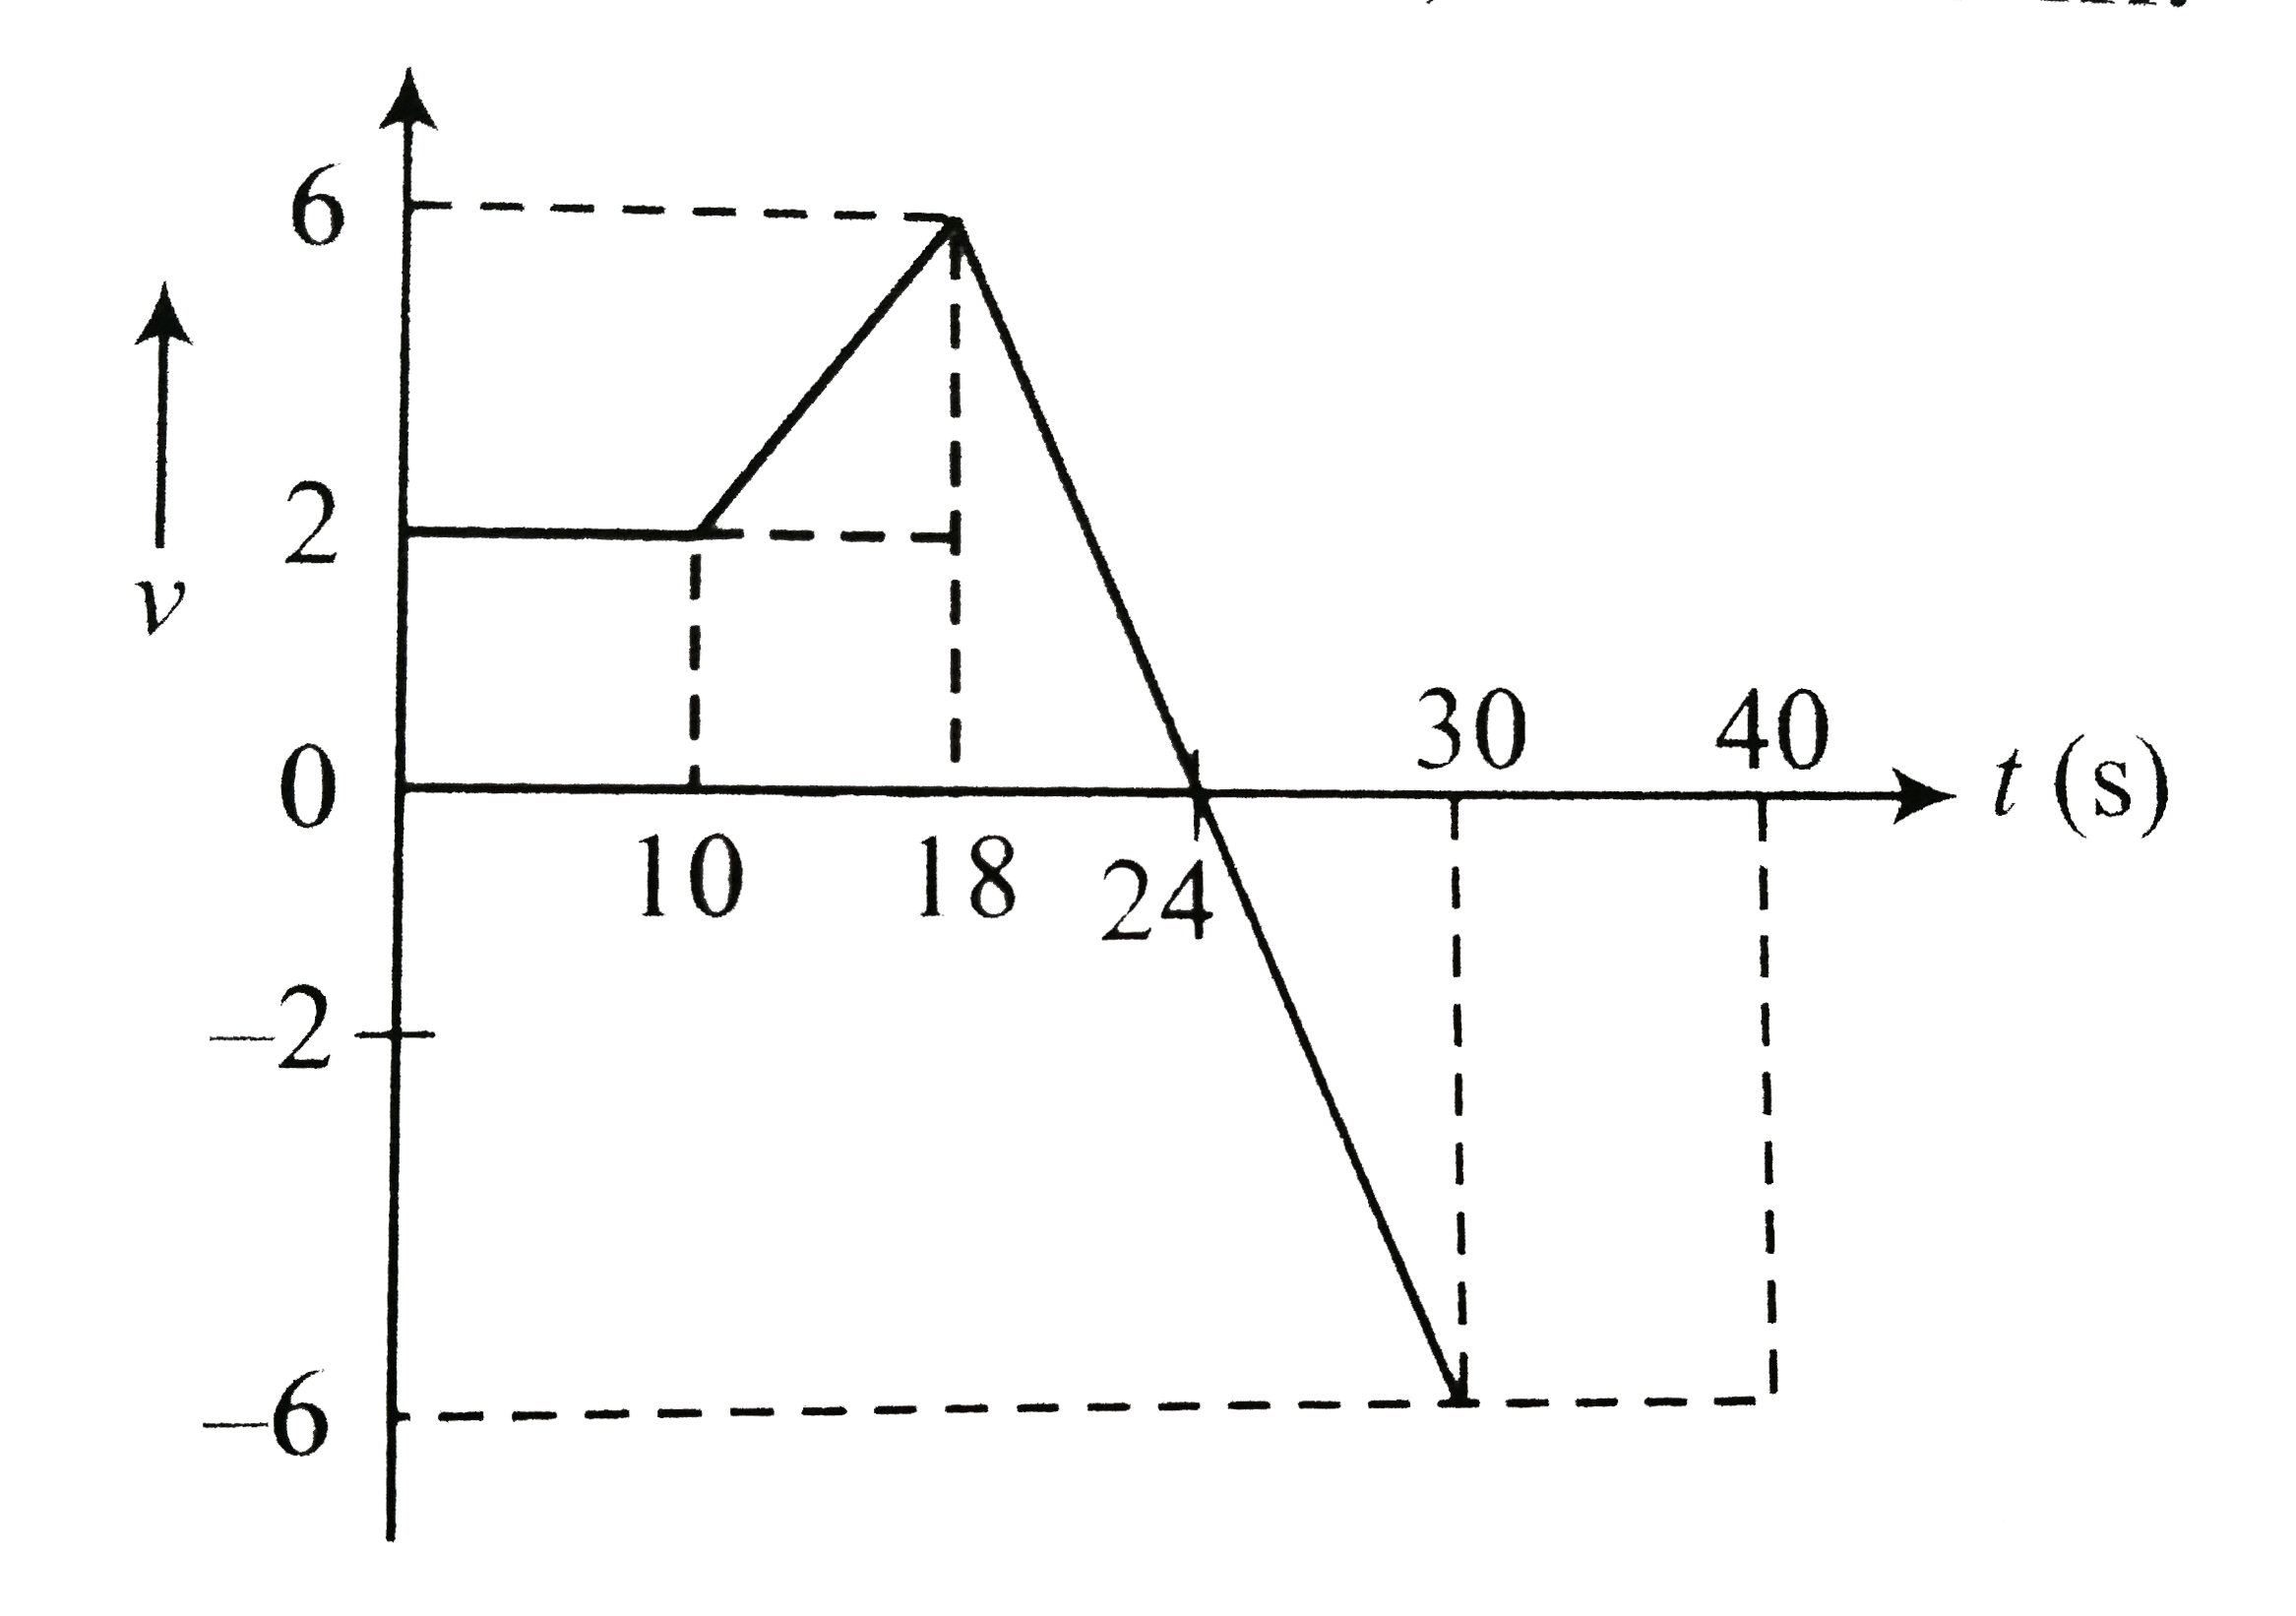
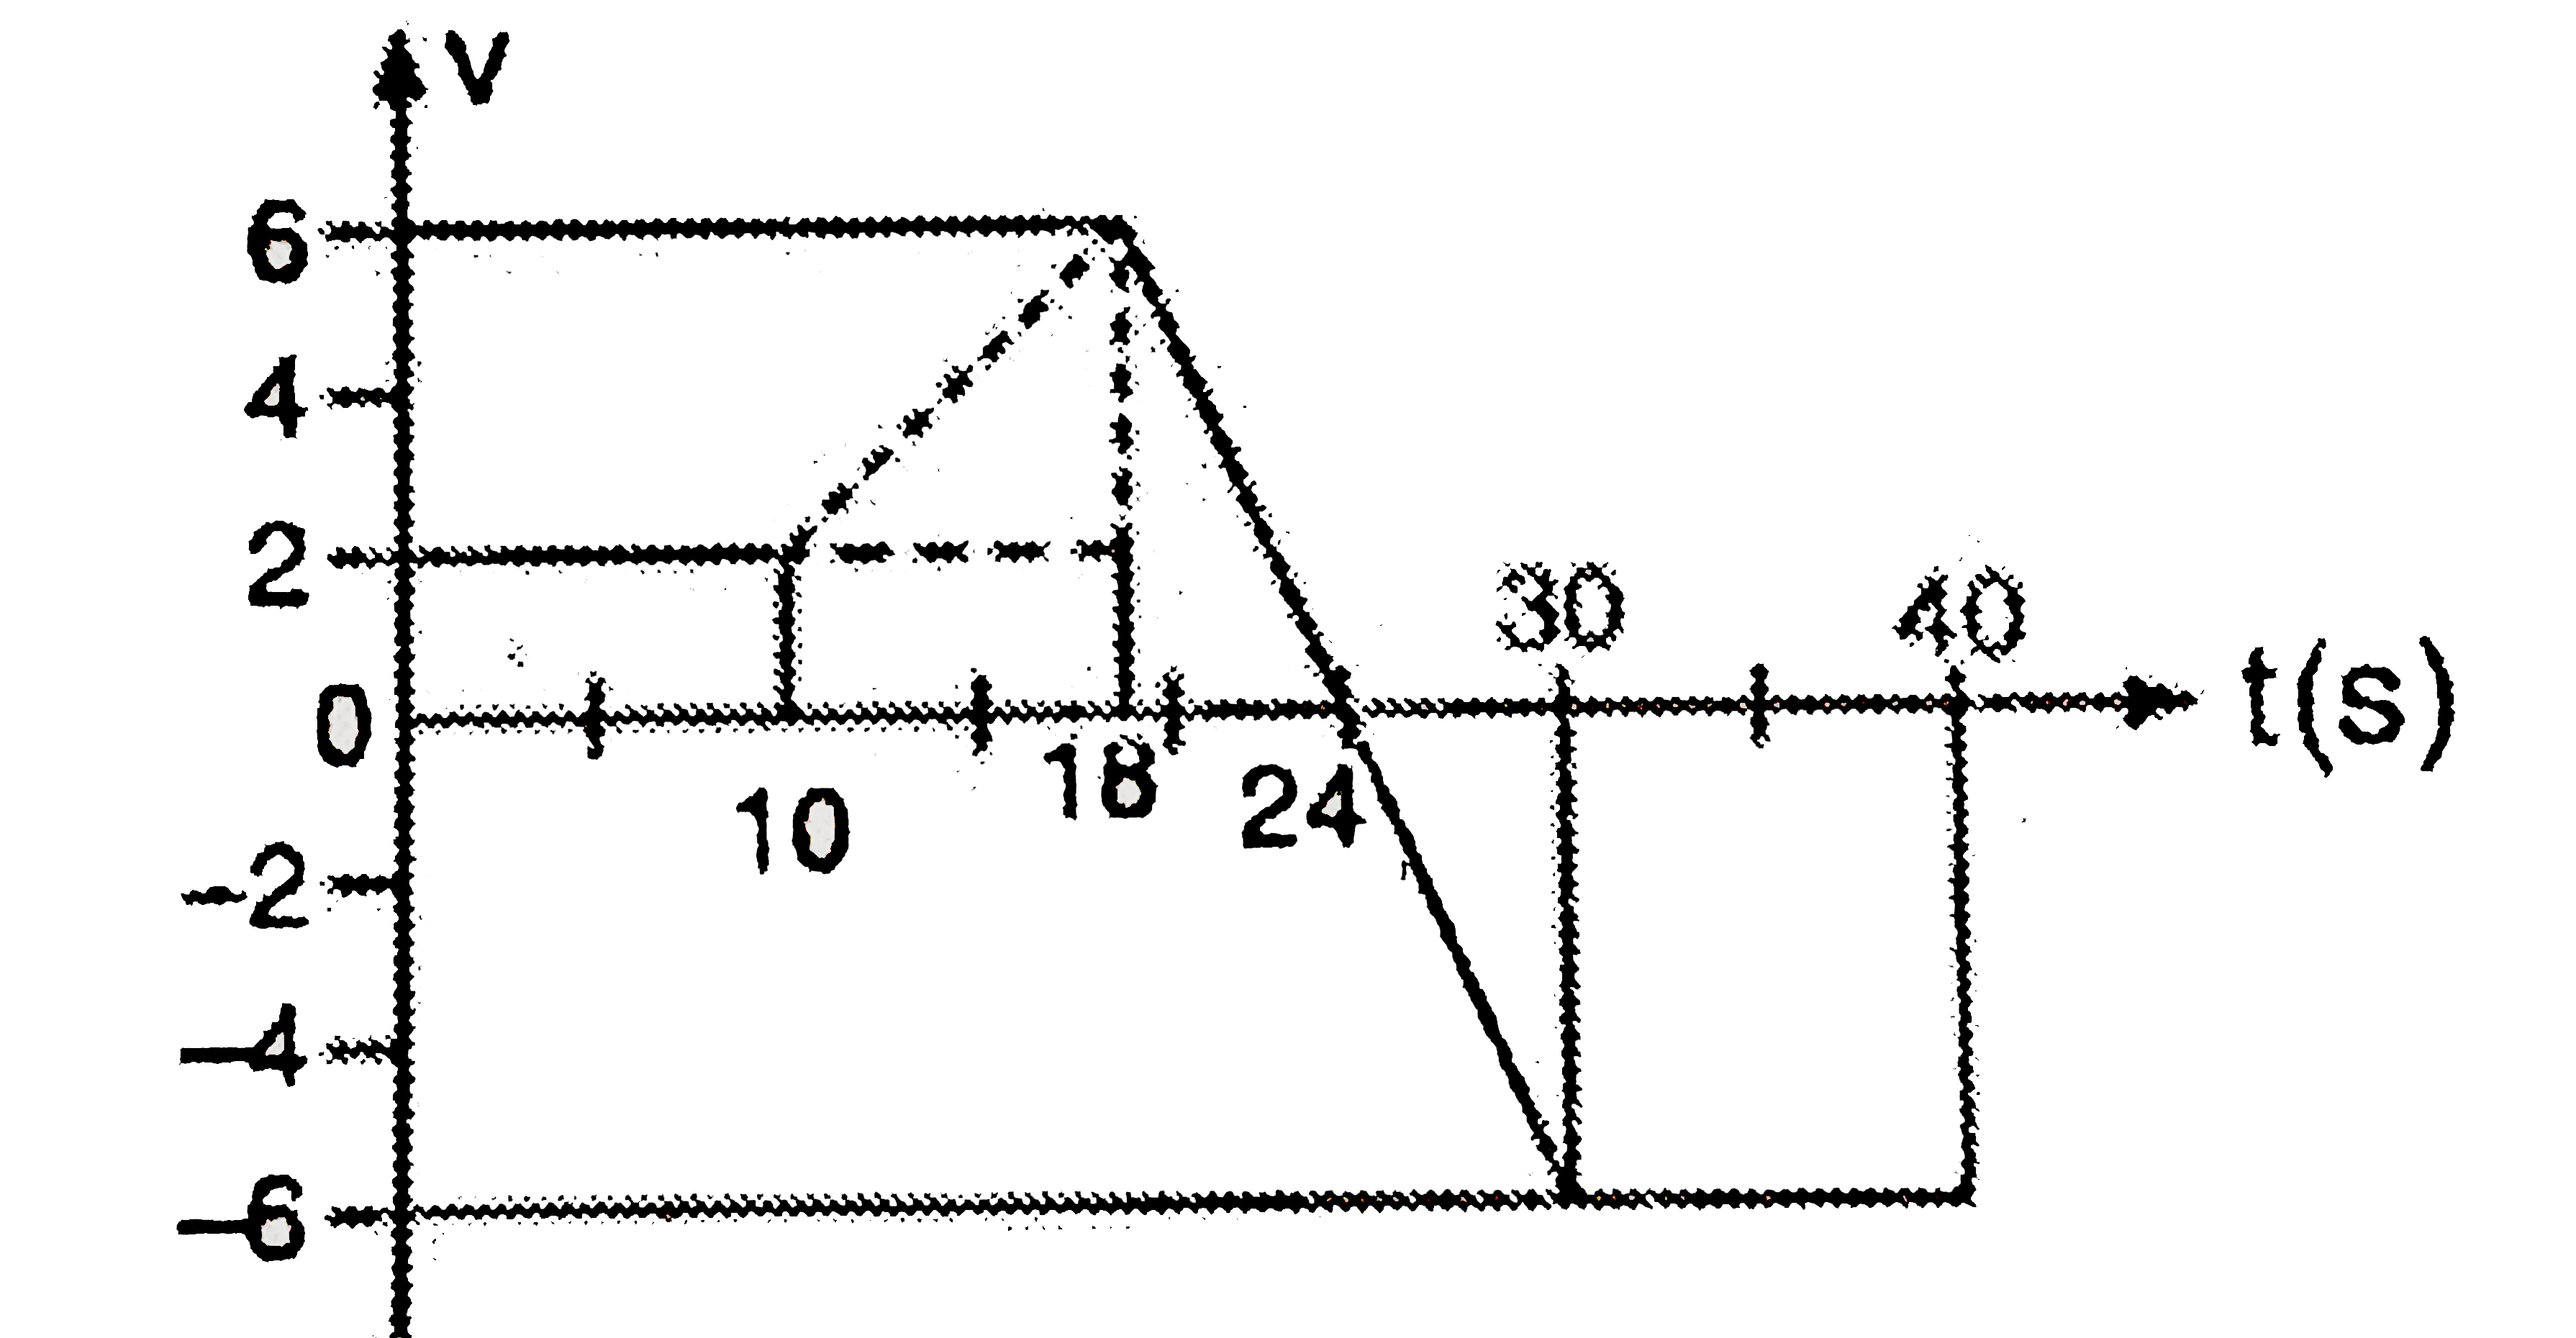
- A particle moves in a straight line with the velocity as shown in. At ...
Text Solution
|