Text Solution
Verified by Experts


Topper's Solved these Questions
SAMPLE QUESTION PAPER 2019
CBSE COMPLEMENTARY MATERIAL|Exercise Section C|19 VideosSAMPLE QUESTION PAPER 2019
CBSE COMPLEMENTARY MATERIAL|Exercise Section C|19 VideosELECTROSTATICS AND CURRENT ELECTRICITY
CBSE COMPLEMENTARY MATERIAL|Exercise NUMERICALS|49 VideosUNIT–III & UNIT–IV MAGNETIC EFFECTS OF CURRENT AND MAGNETISM & E.M.I. AND ALTERNATING CURRENT
CBSE COMPLEMENTARY MATERIAL|Exercise (NUMERICALS)|57 Videos
Similar Questions
Explore conceptually related problems
CBSE COMPLEMENTARY MATERIAL-SAMPLE QUESTION PAPER 2019-Section B
- Analternating voltage E= E0 sin omegat is applied to a circuit contain...
Text Solution
|
- Analternating voltage E= E0 sin omegat is applied to a circuit contain...
Text Solution
|
- The magnetic field in a plane electromagnetic wave is given by: By=12 ...
Text Solution
|
- The magnetic field in a plane electromagnetic wave is given by: By=12 ...
Text Solution
|
- A spherical convex surface of radıus of curvature 20 cm, made of glass...
Text Solution
|
- Name the optoelectronic device used for detecting optical signals and ...
Text Solution
|
- A monochromatic light source of intensity 5 m W emits (8x10^15) photon...
Text Solution
|
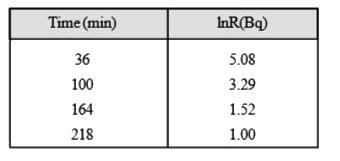
- The following table shows some measurements of the decay rate of a rad...
Text Solution
|