Home
Class 12
PHYSICS
In an experiment , to find the loss of e...

In an experiment , to find the loss of energy with respect to time in case of swinging simple pendulum , the graph between `(amplitude)^2` and time is

A

B

C

D

Text Solution

AI Generated Solution

The correct Answer is:
To solve the question regarding the graph between the square of the amplitude and time for a swinging simple pendulum experiencing energy loss, we can follow these steps: ### Step 1: Understand the Concept of Energy Loss in a Pendulum When a simple pendulum swings, it converts potential energy to kinetic energy and vice versa. However, due to air resistance and friction at the pivot, some energy is lost over time. This loss of energy results in a decrease in the amplitude of the pendulum's swing. **Hint:** Think about how energy is conserved in an ideal pendulum versus a real pendulum with energy losses. ### Step 2: Analyze the Behavior of Amplitude Over Time As the pendulum swings back and forth, the amplitude (the maximum displacement from the rest position) will decrease over time due to energy loss. This means that the amplitude is not constant; it diminishes gradually. **Hint:** Consider how the pendulum behaves after each swing and how the height it reaches decreases. ### Step 3: Relate Amplitude to Time The amplitude can be related to time in a way that shows a decrease. If we denote the amplitude at time \( t \) as \( A(t) \), we can say that \( A(t) \) decreases over time. The square of the amplitude, \( A^2(t) \), will also decrease over time. **Hint:** Think about how a graph of a decreasing quantity looks over time. ### Step 4: Determine the Shape of the Graph Since the amplitude decreases over time, the graph of \( A^2 \) versus time will show a downward trend. The relationship can be approximated as an exponential decay, which is often represented as a hyperbolic curve on a graph. **Hint:** Visualize or sketch what a graph looks like when a quantity decreases continuously. ### Step 5: Conclude the Type of Graph Based on the analysis, the graph between \( (amplitude)^2 \) and time will be a decreasing curve, indicating that as time progresses, the square of the amplitude decreases due to the loss of energy. **Hint:** Remember that the graph should reflect the continuous loss of energy, leading to a steady decrease in amplitude. ### Final Answer The graph between \( (amplitude)^2 \) and time for a swinging simple pendulum experiencing energy loss is a downward-sloping curve, indicating a decrease in amplitude over time.
Promotional Banner

Topper's Solved these Questions

  • NTA NEET SET 56

    NTA MOCK TESTS|Exercise PHYSICS|45 Videos
  • NTA NEET SET 58

    NTA MOCK TESTS|Exercise PHYSICS|45 Videos

Similar Questions

Explore conceptually related problems

For a simple pendulum the graph between length and time period will be

What is the time period of a simple pendulum ?

Time period of simple pendulum increase with

In case of a simple pendulum, time period versus length is depicted by

The graph of time period (T) of a simple pendulum versus its length (I) is

NTA MOCK TESTS-NTA NEET SET 57-PHYSICS
  1. If the change in the value of g at a height h above the surface of the...

    Text Solution

    |

  2. An artificial satellite moving in circular orbit around the earth has ...

    Text Solution

    |

  3. A particle of mass m is acted upon by a force F= t^2-kx . Initially , ...

    Text Solution

    |

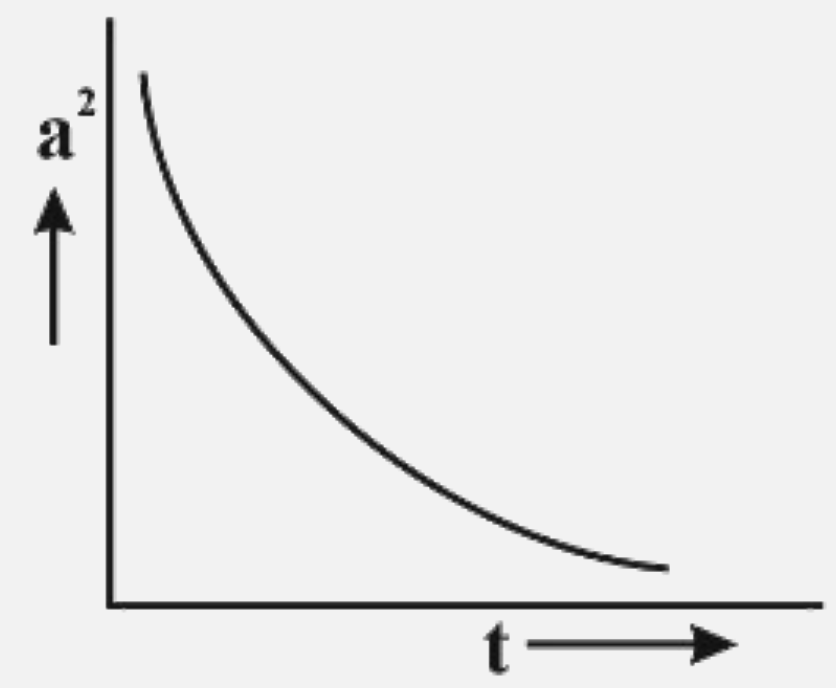
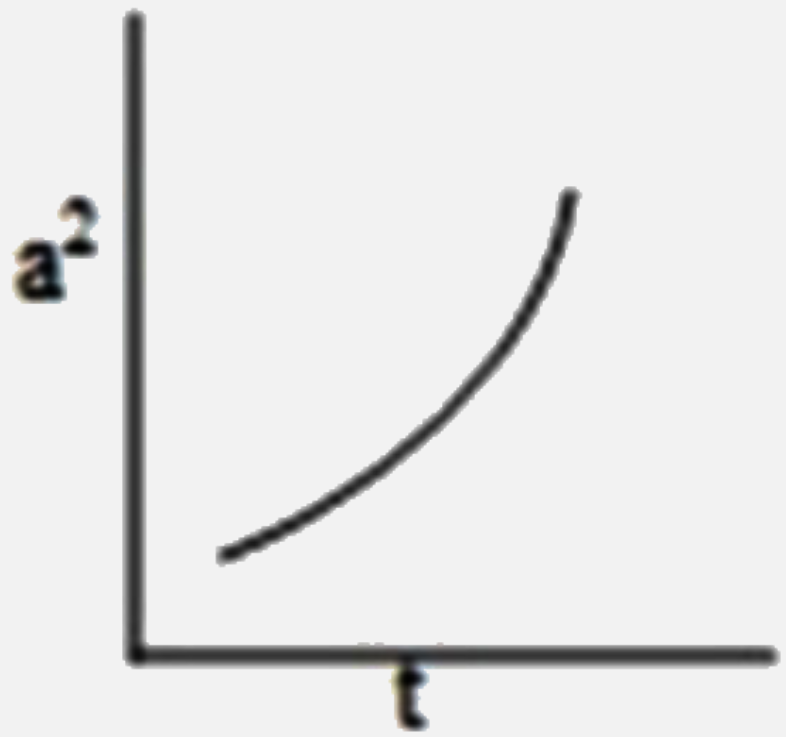
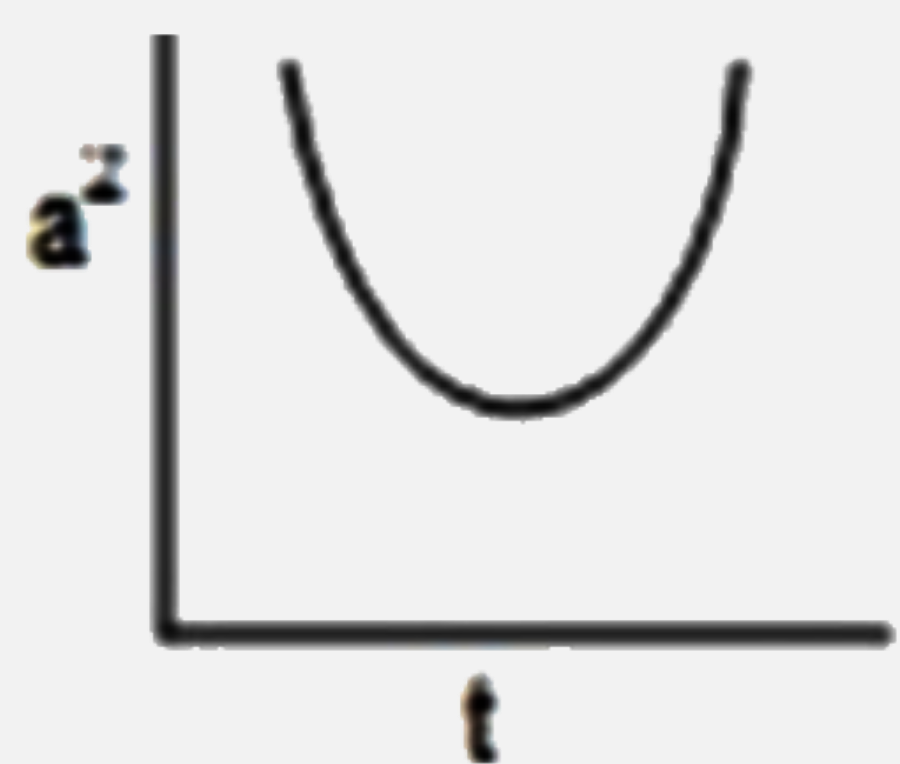
  4. In an experiment , to find the loss of energy with respect to time in ...

    Text Solution

    |

  5. A ball falling in a lake of depth 200 m shows a decrease of 0.1% in i...

    Text Solution

    |

  6. A capillary glass tube records a rise of 20cm when dipped in water. Wh...

    Text Solution

    |

  7. The moment of intertia of a disc about an axis passing through its cen...

    Text Solution

    |

  8. Three identical blocks A, B and C are placed on horizontal frictionles...

    Text Solution

    |

  9. A beam of alpha - particle is incident on a gold foil . Corresponding ...

    Text Solution

    |

  10. According to Bohr's theory, the time averaged magnetic field at the ce...

    Text Solution

    |

  11. The activity of a radioactive element decreases to one third of the or...

    Text Solution

    |

  12. The stopping potential as a function of the frequency of the incident ...

    Text Solution

    |

  13. According to Einstein's photoelectric equation , the graph between the...

    Text Solution

    |

  14. The following figure shows a logic gate circuit with two inputs A and ...

    Text Solution

    |

  15. In a common base transistor circuit, the current gain is 0.98. On cha...

    Text Solution

    |

  16. A common emitter transistor amplifier has a current gain of 50. If the...

    Text Solution

    |

  17. Calculate the dispersive power for crown glass from the given data m...

    Text Solution

    |

  18. The face AC of a prism ABC of refracting angle 30^@ is silvered . A r...

    Text Solution

    |

  19. A beam of light of wave length 600 nm from a distance source fall on a...

    Text Solution

    |

  20. Two polaroids are placed in the path of unpolarized beam of intensity ...

    Text Solution

    |