A
B
C
D
Text Solution
Verified by Experts
The correct Answer is:


Topper's Solved these Questions
Similar Questions
Explore conceptually related problems
AAKASH INSTITUTE-MOTION IN A STRAIGHT LINE-ASSIGNMENT (SECTION - D)
- A : It is not possible to have constant velocity and variable accelera...
Text Solution
|
- A : The direction of velocity of an object can be reversed with consta...
Text Solution
|
- A : When the velocity of an object is zero at an instant, the accelera...
Text Solution
|
- A : A body moving with decreasing speed may have increasing accelerati...
Text Solution
|
- A : for a moving particle distance can never be negative or zero. R ...
Text Solution
|
- A : If speed of a particle is never zero than it may have zero averag ...
Text Solution
|
- A : The magntidue of average velocity in an interval can never be grea...
Text Solution
|
- A : The area under acceleration - time graph is equal to velocity of o...
Text Solution
|
- A : The motion of body projected under the effect of gravity without a...
Text Solution
|
- A : The relative acceleration of two objects moving under the effect o...
Text Solution
|
- A : In the presence of air resistance, if the ball is thrown verticall...
Text Solution
|
- A : The following graph can't exist actually R :Total path length...
Text Solution
|
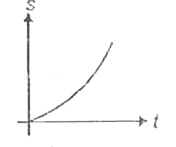
- A : The displacement (s) time graph shown in the figure represents an ...
Text Solution
|
- A : Average velocity can be zero, but average speed of a moving body c...
Text Solution
|
- A : For a particle moving in a straight line, its acceleration must be...
Text Solution
|