A

B

C

D
Text Solution
Verified by Experts
The correct Answer is:


Topper's Solved these Questions
ALTERNATING CURRENT
NCERT FINGERTIPS|Exercise Ac Voltage Applied To A Capacitor|12 VideosALTERNATING CURRENT
NCERT FINGERTIPS|Exercise Ac Voltage Applied To A Series Lcr Circuit|28 VideosALTERNATING CURRENT
NCERT FINGERTIPS|Exercise Assertion And Reason|15 VideosATOMS
NCERT FINGERTIPS|Exercise Assertion And Reason|15 Videos
Similar Questions
Explore conceptually related problems
NCERT FINGERTIPS-ALTERNATING CURRENT -Ac Voltage Applied To A Inductor
- In the case of an inductor
Text Solution
|
- An ideal inductor is in turn put across 220 V, 50 Hz and 220 V, 100 Hz...
Text Solution
|
- An inductor of 30 mH is connected to a 220 V, 100 Hz ac source. The in...
Text Solution
|
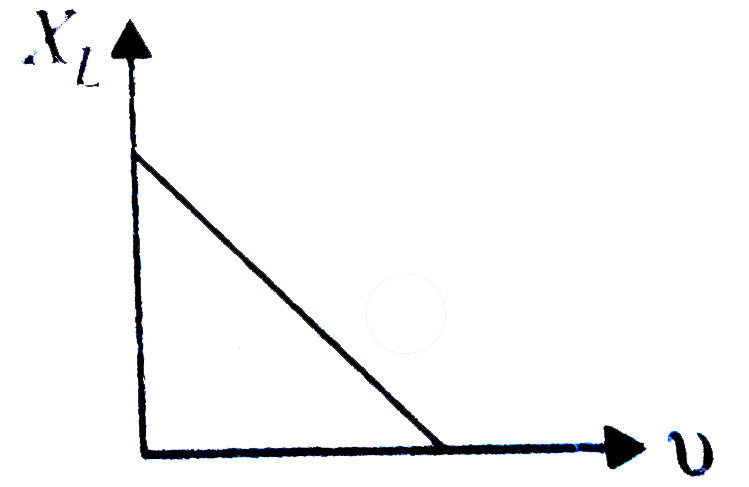
- Which of the following graphs represent the correct variation of induc...
Text Solution
|
- A 44 mH inductor is connected to 220 V, 50 Hz ac supply. The rms valu...
Text Solution
|