A

B
C

D
Text Solution
Verified by Experts
The correct Answer is:


Topper's Solved these Questions
Similar Questions
Explore conceptually related problems
NARAYNA-ELECTRIC CHARGES AND FIELDS-EXERCISE -4
- Three charges +q, +q, +2q are arranged as shown in figure. What is the...
Text Solution
|
- Point P is at a distance of r(gtR) from the axis of the cylinder. The ...
Text Solution
|
- An electron is projected as in fig. at a speed of 6x10^(6)ms^(-1) at a...
Text Solution
|
- Two large conducting plates are placed parallel to each other with a s...
Text Solution
|
- Three charges -q(1), +q(2) and -q(3) are placed as shown in the figure...
Text Solution
|
- An electron is projected from a distance d and with initial velocity u...
Text Solution
|
- Three large parallel plates have uniform surface charge densities as s...
Text Solution
|
- A particles of mass 1kg and carrying positive charge 0.01C is sliding ...
Text Solution
|
- six charges of equal magnitude, 3 poistive and 3 negative are to be pl...
Text Solution
|
- Three concentric metallic spherical shells of radii R, 2R, 3R are give...
Text Solution
|
- If E(a) be the electric field strength of a short dipole at a point on...
Text Solution
|
- A positive charge Q is uniformly distributed along a circular ring of ...
Text Solution
|
- A hemispherical shell is uniformly charge positively .the electric fie...
Text Solution
|
- A point charge +q, is placed at a distance d from an isolated conducti...
Text Solution
|
- An insulator (non-conductor) can be charged by a. conduction (b) ind...
Text Solution
|
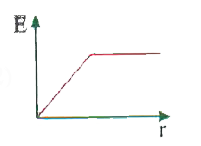
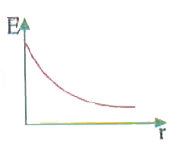
- Which one of the following graphs represents the variation of electric...
Text Solution
|
- In a liquid medium of dielectric constant K and specific gravity 2 two...
Text Solution
|
- A particle of mass 1kg and carrying 0.01C is at rest on an inclined pl...
Text Solution
|
- v33.2
Text Solution
|
- A bob of a simple pendulum of mass 40gm with a positive charge 4xx10^(...
Text Solution
|