Home
Class 11
PHYSICS
For a simple pendulum, a graph is plotte...

For a simple pendulum, a graph is plotted between itskinetic energy `(KE)` and potential energy `(PE)`against its displacement `d`. Which one of the following represents these correctly? (graph are schematic and not drawn to scale)

A

B

C

D

Text Solution

Verified by Experts

The correct Answer is:
B

K.E is maximum at mean position, where as P.E is minimum
At extreme position, K.E is minimum and P.E is maximum
Promotional Banner

Topper's Solved these Questions

  • OSCILLATIONS

    NARAYNA|Exercise EXERCISE - II (H.W)|19 Videos
  • OSCILLATIONS

    NARAYNA|Exercise EXERCISE - III|29 Videos
  • OSCILLATIONS

    NARAYNA|Exercise EXERCISE - I (H.W)|66 Videos
  • NEWTONS LAWS OF MOTION

    NARAYNA|Exercise PASSAGE TYPE QUESTION|6 Videos
  • PHYSICAL WORLD

    NARAYNA|Exercise C.U.Q|10 Videos

Similar Questions

Explore conceptually related problems

For a simple pendulum, a graph is plotted its kinetic energy (KE) and potential energy (PE) against its displacement d. Which one of the following represents these correctly?

The potential energy in given according to the following graph. Which of the following graph represent the force?

Which of the following graph is correct between kinetic energy E , potential energy (U) and height (h) from the ground of the partical

In the fig. The potential energy U of a particle plotted against its position x from origin. Which of the following statement is correct

A body executes simple harmonic motion. The potential energy (P.E), the kinetic energy (K.E) and energy (T.E) are measured as a function of displacement x . Which of the following staements is true?

The graph between potential energy and displacement of a particle performing S.H.M. is

A graph is plotted by taking translational kinetic energy of body as ordinate and velocity as abscissa. Slope of the graph at an instant represents its

NARAYNA-OSCILLATIONS-EXERCISE - II (C.W)
  1. The displacement - time graph of a particle executing SHM is as shown ...

    Text Solution

    |

  2. The acceleration of the particle at t = 3 s in the above figure is

    Text Solution

    |

  3. The minimum time the particle takes to travel from y = + "1 m to y" = ...

    Text Solution

    |

  4. Match the following {:("List - I","List - II"),("(a) acceleration","...

    Text Solution

    |

  5. For a particle executing SHM along a straight line (displacement is me...

    Text Solution

    |

  6. {:("List - I","List - II"),("(A) x-t graph of simple harmonic oscillat...

    Text Solution

    |

  7. The mass and diameter of a planet are twice those of earth. What will ...

    Text Solution

    |

  8. The length of a second's pendulum on the surface of the moon, where g ...

    Text Solution

    |

  9. The matallic bob of a simple pendulum has the relative density rho. Th...

    Text Solution

    |

  10. A pendulum clock is taken 1km inside the earth from mean sea level. Th...

    Text Solution

    |

  11. A seconds pendulum is suspended from rof of a vehicle that is moving a...

    Text Solution

    |

  12. For a simple pendulum, the graph between T^(2) and L (where T is the t...

    Text Solution

    |

  13. In case of a simple pendulum, time period versus length is depicted by

    Text Solution

    |

  14. Assuming the earth as an spherical body, for seconds pendulum {:("Co...

    Text Solution

    |

  15. {:("List - I","List - II"),("(A) Frequency of seconds pendulum","(E)"A...

    Text Solution

    |

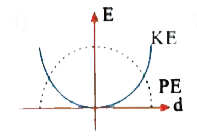
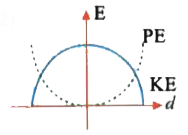
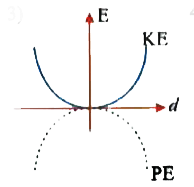
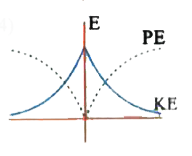
  16. For a simple pendulum, a graph is plotted between itskinetic energy (K...

    Text Solution

    |

  17. As a body performs SHM its potential energy U. varies with time as ind...

    Text Solution

    |

  18. A particle of mass m oscillates with simple harmonic motion between po...

    Text Solution

    |

  19. A simple harmonic oscillator (A) Always has maximum KE at the equili...

    Text Solution

    |

  20. Which of the following figure represents damped harmonic motion

    Text Solution

    |