A
B
C
D
Text Solution
Verified by Experts
The correct Answer is:


Topper's Solved these Questions
Similar Questions
Explore conceptually related problems
RESONANCE-ELECTROSTATICS-Part - II Section (I)
- A square of side 'a' is lying in xy plane such that two of its sides a...
Text Solution
|
- If electric field is uniform, then the electric lines of forces are :
Text Solution
|
- The figure shows the electric lines of force emerging from a charged b...
Text Solution
|
- Select the correct statement :
Text Solution
|
- If the electric flux entering and leaving an enclosed surface respecti...
Text Solution
|
- An electric dipole is placed at the centre of a sphere. Mark the corre...
Text Solution
|
- Figure shown an imaginary cube of edge L/2. A uniformly Charged rod o...
Text Solution
|
- Electric charges are distributed in a small volume. The flux of the el...
Text Solution
|
- Eight point charges (can be assumed as small spheres uniformly charged...
Text Solution
|
- Figure shows two large cylindrical shells having uniform linera charge...
Text Solution
|
- A position charge Q is placed at a distance of 4R above the centre of ...
Text Solution
|
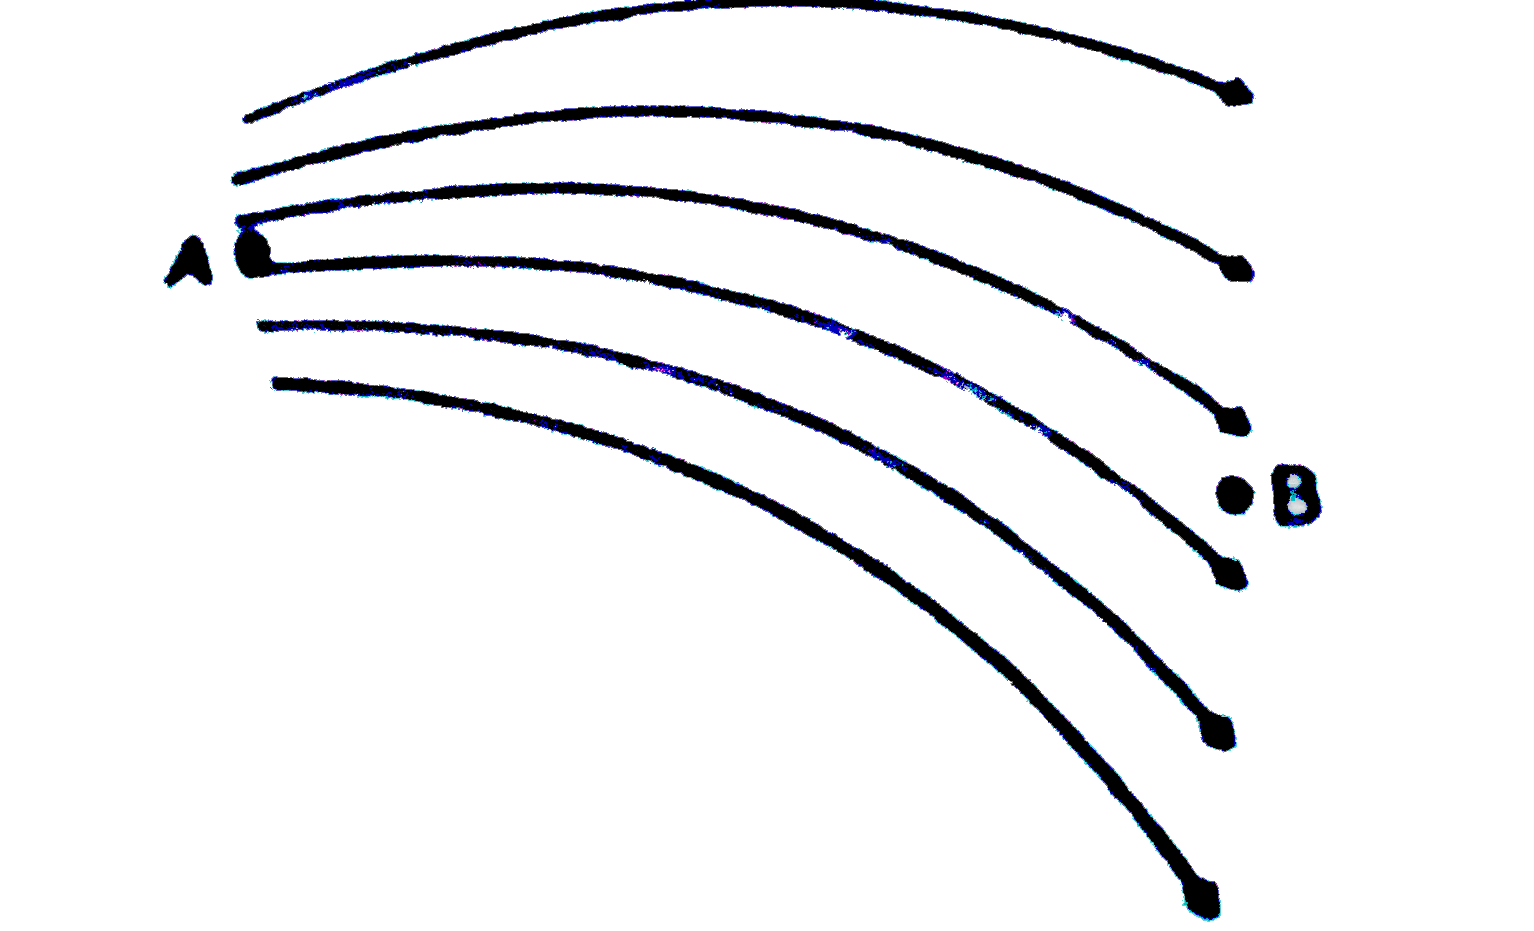
- The given figure gives electric line of force due to two charges q(1) ...
Text Solution
|
- Three poistive charges of equal value q are placed at the vertices of ...
Text Solution
|
- A cylinder on whose surfaces there is a vertical electric field of var...
Text Solution
|