Text Solution
Verified by Experts


Topper's Solved these Questions
KINEMATICS (MOTION ALONG A STRAIGHT LINE AND MOTION IN A PLANE)
ALLEN|Exercise BEGINNER S BOX-1|6 VideosKINEMATICS (MOTION ALONG A STRAIGHT LINE AND MOTION IN A PLANE)
ALLEN|Exercise BEGINNER S BOX-2|7 VideosKINEMATICS
ALLEN|Exercise Integer Type Question|3 VideosMISCELLANEOUS
ALLEN|Exercise SUBJECTIVE QUESTION|9 Videos
Similar Questions
Explore conceptually related problems
ALLEN-KINEMATICS (MOTION ALONG A STRAIGHT LINE AND MOTION IN A PLANE)-BEGINNER S BOX-7
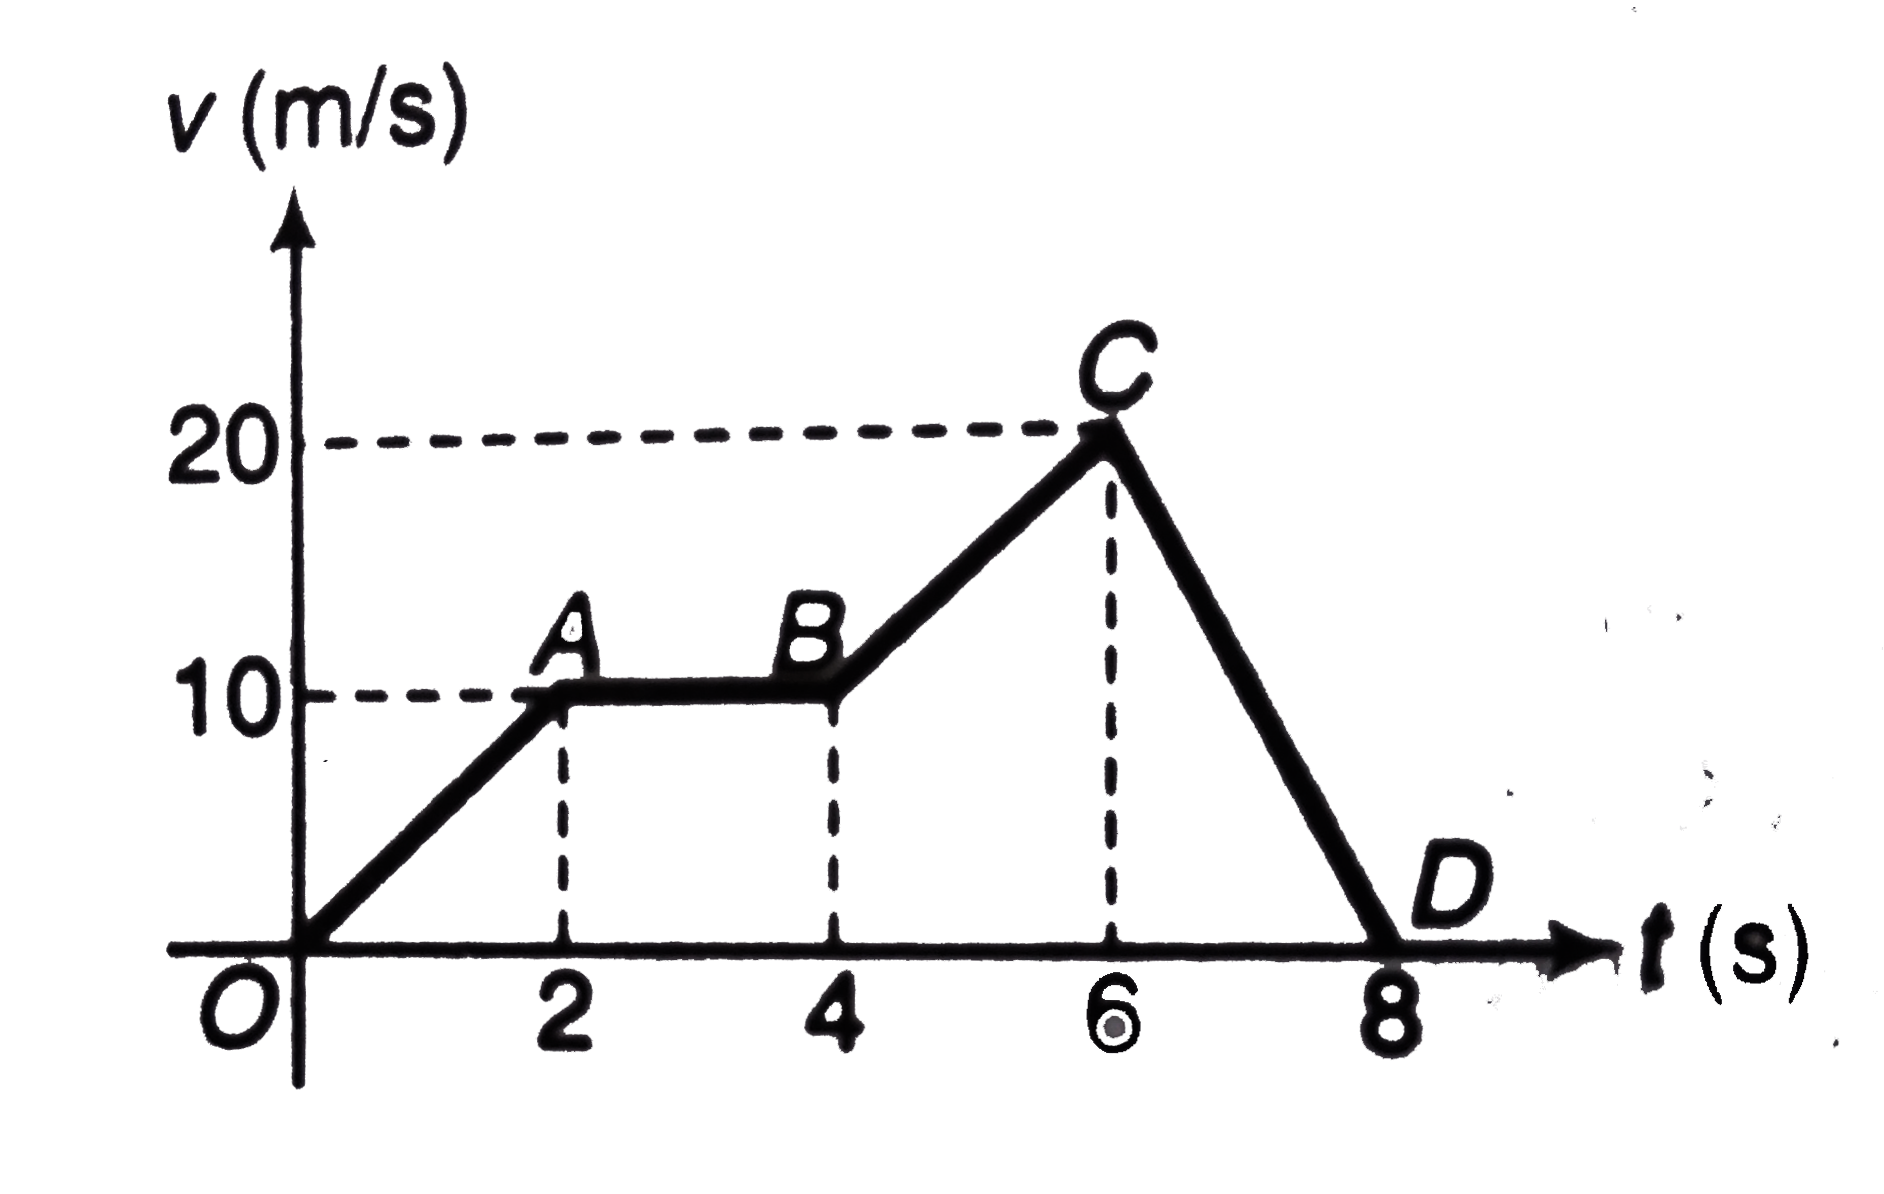
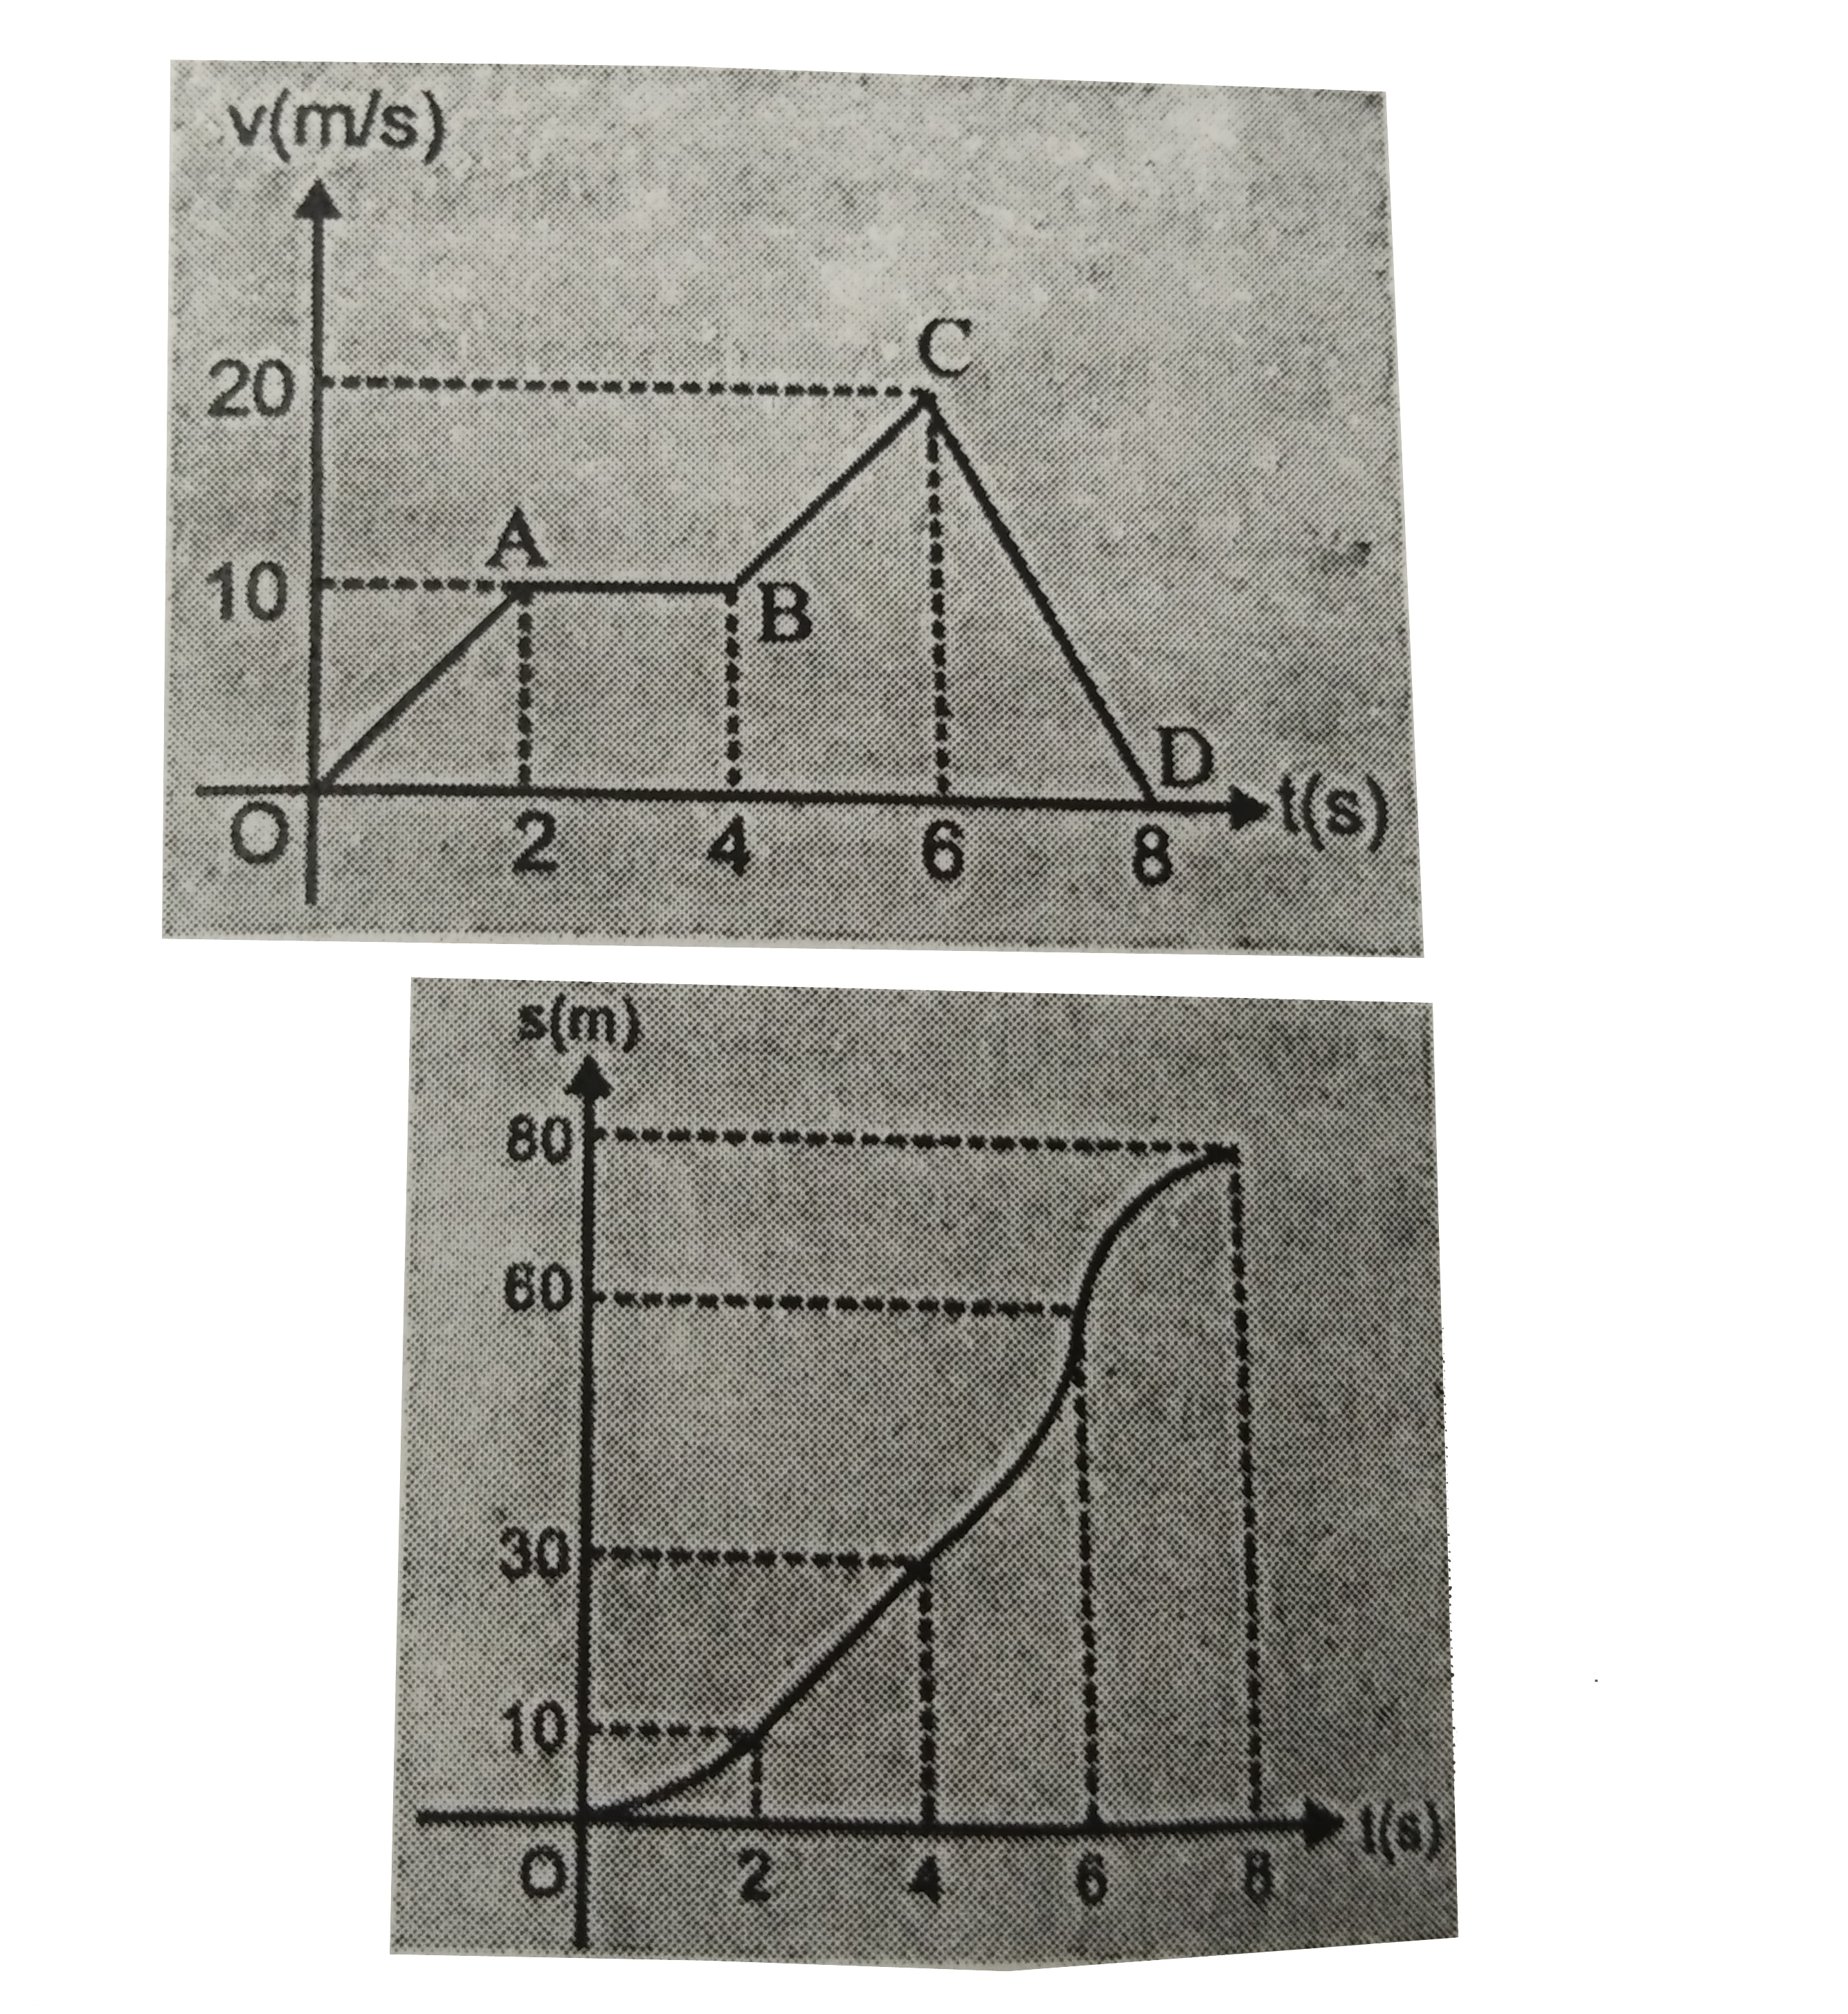
- Velocity-time graph of a particle moving in a straight line is shown i...
Text Solution
|
- A football player kicks a ball at ball at an angle of 30 ^(0) with the...
Text Solution
|
- A cricketer can throw a ball to a maximum horizontal distance of 100 ...
Text Solution
|
- Two bodies are thrown with the same initial speed at angles alpha and ...
Text Solution
|
- A ball is thown at angle theta and another ball is thrown at angle (90...
Text Solution
|
- The range of a projectile launched at an angle of 15^(@) with horizont...
Text Solution
|
- Show that projection angle theta(0) for a projectile launched from the...
Text Solution
|
- A ball of mass (m) is thrown vertically up. Another ball of mass 2 m ...
Text Solution
|
- The ceiling of a long hall is 20 m high. What is the maximum horizonta...
Text Solution
|