Text Solution
Verified by Experts


Topper's Solved these Questions
KINEMATICS (MOTION ALONG A STRAIGHT LINE AND MOTION IN A PLANE)
ALLEN|Exercise BEGINNER S BOX-6|9 VideosKINEMATICS (MOTION ALONG A STRAIGHT LINE AND MOTION IN A PLANE)
ALLEN|Exercise BEGINNER S BOX-7|8 VideosKINEMATICS (MOTION ALONG A STRAIGHT LINE AND MOTION IN A PLANE)
ALLEN|Exercise BEGINNER S BOX-4|6 VideosKINEMATICS
ALLEN|Exercise Integer Type Question|3 VideosMISCELLANEOUS
ALLEN|Exercise SUBJECTIVE QUESTION|9 Videos
Similar Questions
Explore conceptually related problems
ALLEN-KINEMATICS (MOTION ALONG A STRAIGHT LINE AND MOTION IN A PLANE)-BEGINNER S BOX-5
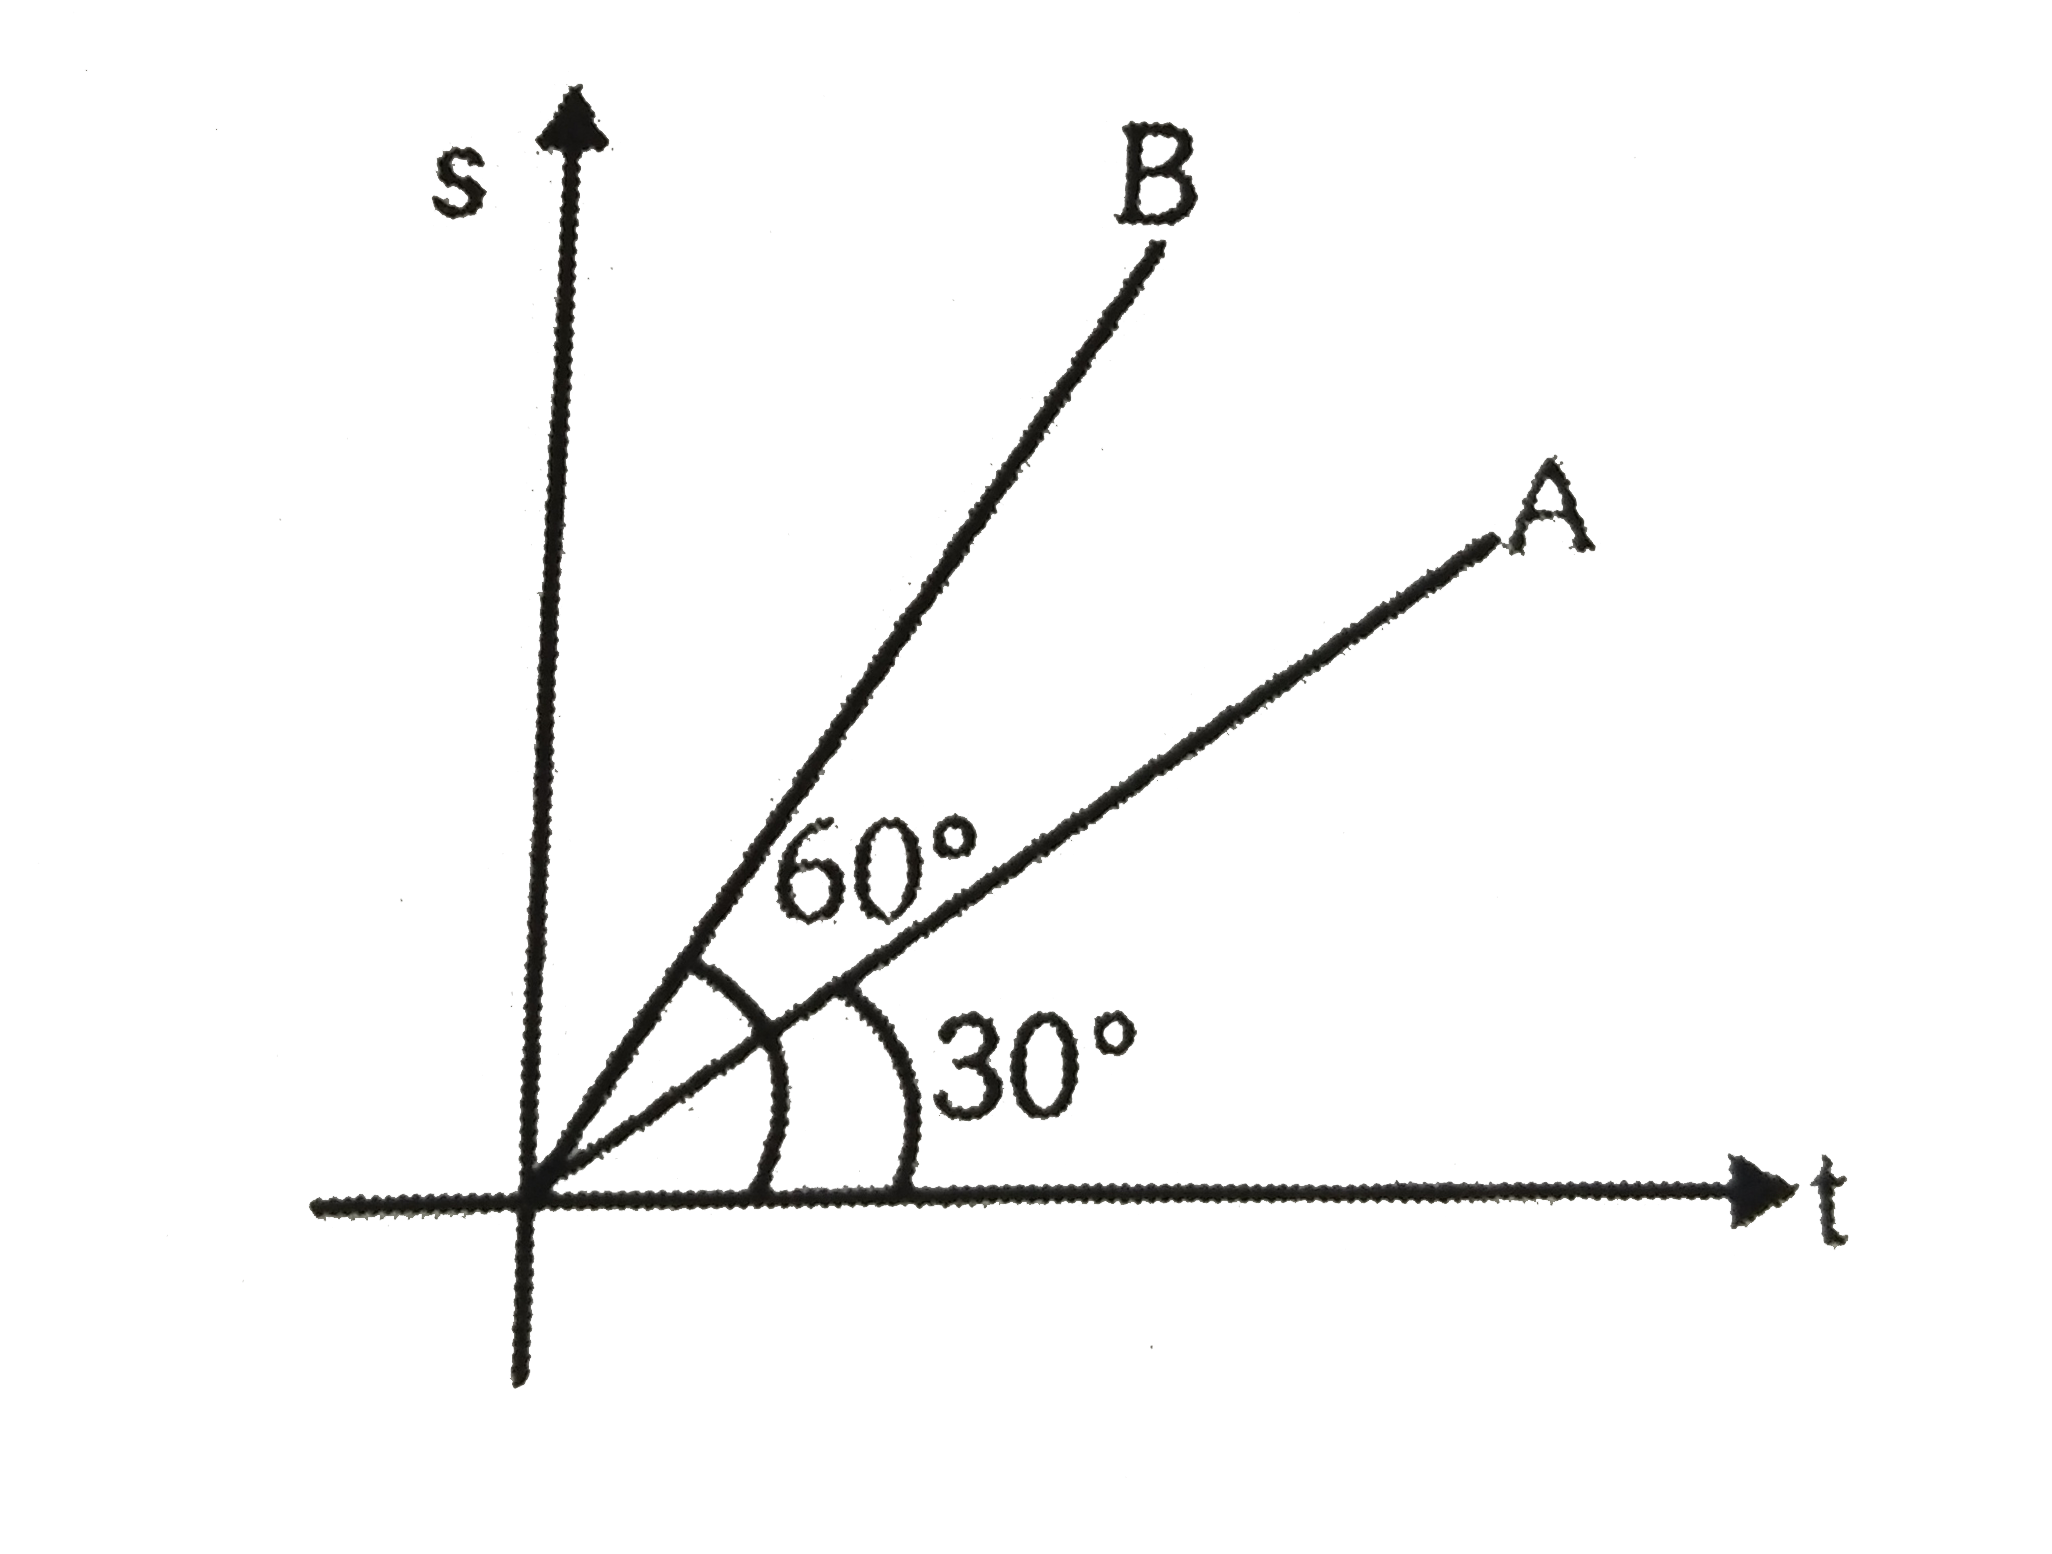
- s-t graph of two particles A and B are shown in fig. Find the ratio of...
Text Solution
|
- Position-time graph of a particle in motion is shown in fig. Calculate...
Text Solution
|
- The position-time (x-t) graphs for two children A and B returning from...
Text Solution
|
- A particle moves on straight line according to the velocity-time graph...
Text Solution
|
- A body starts from rest and moves with a uniform acceleration of 10ms^...
Text Solution
|