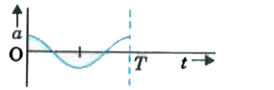
A
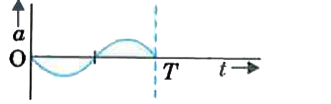
B
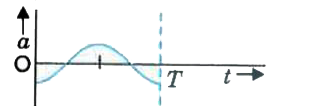
C
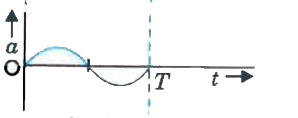
D
Text Solution
Verified by Experts
The correct Answer is:


Topper's Solved these Questions
OSCILLATIONS
MODERN PUBLICATION|Exercise Competition file (Multiple choice question) JEE (Main) & Other State Boards for Engineering Entrance|25 VideosOSCILLATIONS
MODERN PUBLICATION|Exercise Competition File (JEE (Advanced) For IIT Entrance)|7 VideosOSCILLATIONS
MODERN PUBLICATION|Exercise Competition File (Multiple choice questions)|20 VideosMOTION IN A STRAIGHT LINE
MODERN PUBLICATION|Exercise CHAPTER PRACTICE TEST|16 VideosPHYSICAL WORLD
MODERN PUBLICATION|Exercise Revision exercises (Long answer questions)|6 Videos
Similar Questions
Explore conceptually related problems
MODERN PUBLICATION-OSCILLATIONS -Competition File (Multiple choice questions) AIPMT/NEET other State Boards for Medical Entrance
- The paricle executing simple harmonic motion had kinetic energy and th...
Text Solution
|
- The distance moved by a particle in simple harmonic motion in one time...
Text Solution
|
- A pendulum is hung from the roof of a sufficiently high building and i...
Text Solution
|
- Two simple harmonic motion of angular frequency 100and 1000 rads^(-1) ...
Text Solution
|
- A point performs simple harmonic oscillation of period T and the equat...
Text Solution
|
- The displacement of a particle along the x- axis it given by x = a sin...
Text Solution
|
- A mass falls from a height h and its time of fall t is recorded in ter...
Text Solution
|
- A mass of 2.0 kg is put on a flat pan attached to a vertical spring fi...
Text Solution
|
- A truck is staitonary and has a bob suspended by a lilght string in a ...
Text Solution
|
- Out of the following functions representing motion of a particle which...
Text Solution
|
- The oscillationof a body on a smooth horizontal surface is represented...
Text Solution
|
- when two displacements represented by y(1) = a sin(omega t) and y(2) =...
Text Solution
|
- A particle is executing SHM along a straight line. Its velocities at d...
Text Solution
|
- A particle executes linear simple harmonic motion with an amplitude of...
Text Solution
|