Text Solution
Verified by Experts


Topper's Solved these Questions
CBSE EXAMINATION PAPER 2020 (SOLVED)
U-LIKE SERIES|Exercise SECTION C|11 VideosCBSE EXAMINATION PAPER 2020 (SOLVED)
U-LIKE SERIES|Exercise SECTION D|11 VideosCBSE EXAMINATION PAPER 2020 (SOLVED)
U-LIKE SERIES|Exercise SECTION D|11 VideosCBSE EXAMINATION PAPER 2020
U-LIKE SERIES|Exercise SECTION D|12 VideosCBSE EXAMINATION PAPER 2020 (SOLVED)
U-LIKE SERIES|Exercise SECTION - D|6 Videos
Similar Questions
Explore conceptually related problems
U-LIKE SERIES-CBSE EXAMINATION PAPER 2020 (SOLVED)-SECTION B
- Derive the expression for the torque acting on an electric dipole, whe...
Text Solution
|
- Obtain the expression for the energy stored in a capacitor connected a...
Text Solution
|
- Gamma rays and radio waves travel with the same velocity in free space...
Text Solution
|
- Light from a sodium lamp (S) passes through two polaroid sheets P(1) a...
Text Solution
|
- Define the term 'wavefront of light'. A plane wave front AB propagatin...
Text Solution
|
- A heavy nucleus P of mass number 240 and binding energy 7.6 MeV per nu...
Text Solution
|
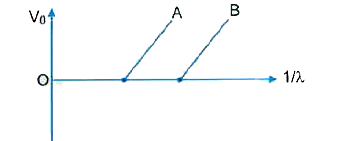
- Figure shows the stopping potential (V(0)) for the photo electron vers...
Text Solution
|
- Figure shows the stopping potential (V(0)) for the photo electron vers...
Text Solution
|
- Use Bohr's model of hydrogen atom to obtain the relationship between t...
Text Solution
|
- In a single slit diffraction experiment, the width of the slit is incr...
Text Solution
|