Text Solution
Verified by Experts


Topper's Solved these Questions
XII BOARDS
XII BOARDS PREVIOUS YEAR|Exercise SET - II (Delhi Board)|8 VideosXII BOARDS
XII BOARDS PREVIOUS YEAR|Exercise SET - III (Delhi Board)|8 VideosXII BOARDS
XII BOARDS PREVIOUS YEAR|Exercise PHYSICS (Theory) [SET - III]|10 VideosSAMPLE PAPER 2019
XII BOARDS PREVIOUS YEAR|Exercise SECTION D|6 Videos
Similar Questions
Explore conceptually related problems
XII BOARDS PREVIOUS YEAR-XII BOARDS-SET - I
- A capacitor has been charged by ad.c. source. What are the magnitudes ...
Text Solution
|
- The relation between angle of incidence i, angle of prism A and angle ...
Text Solution
|
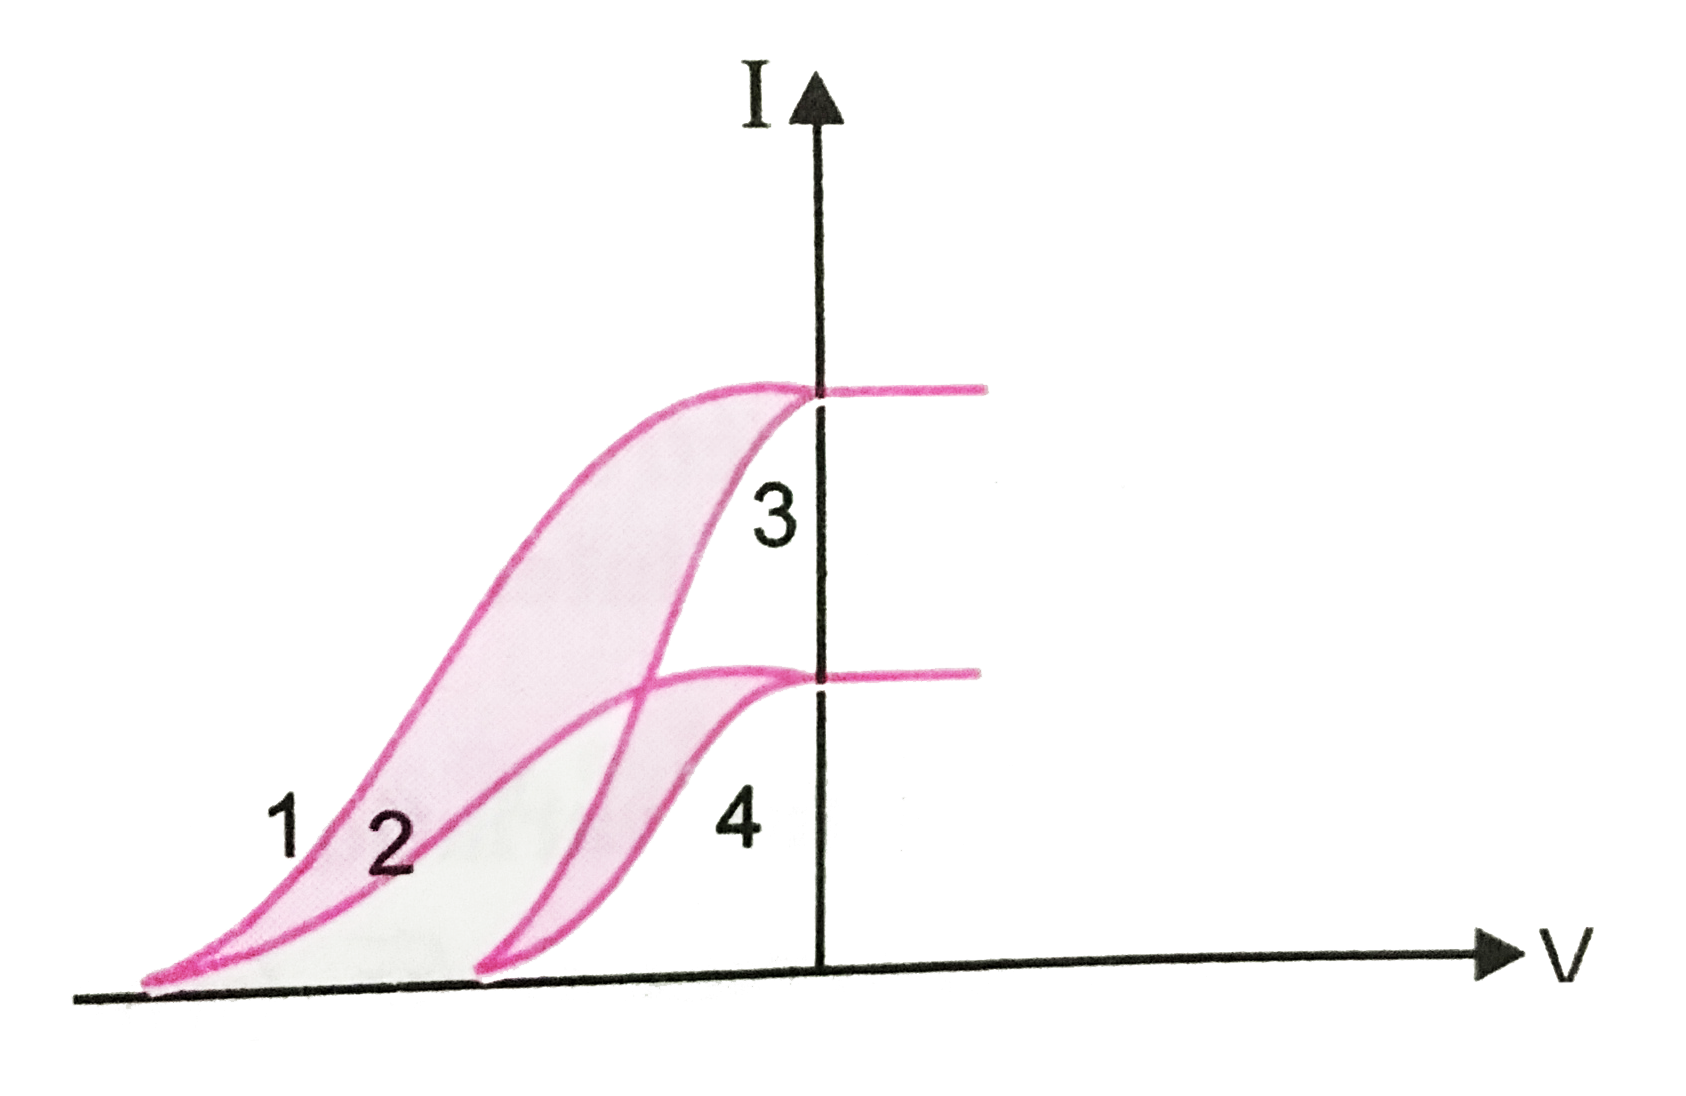
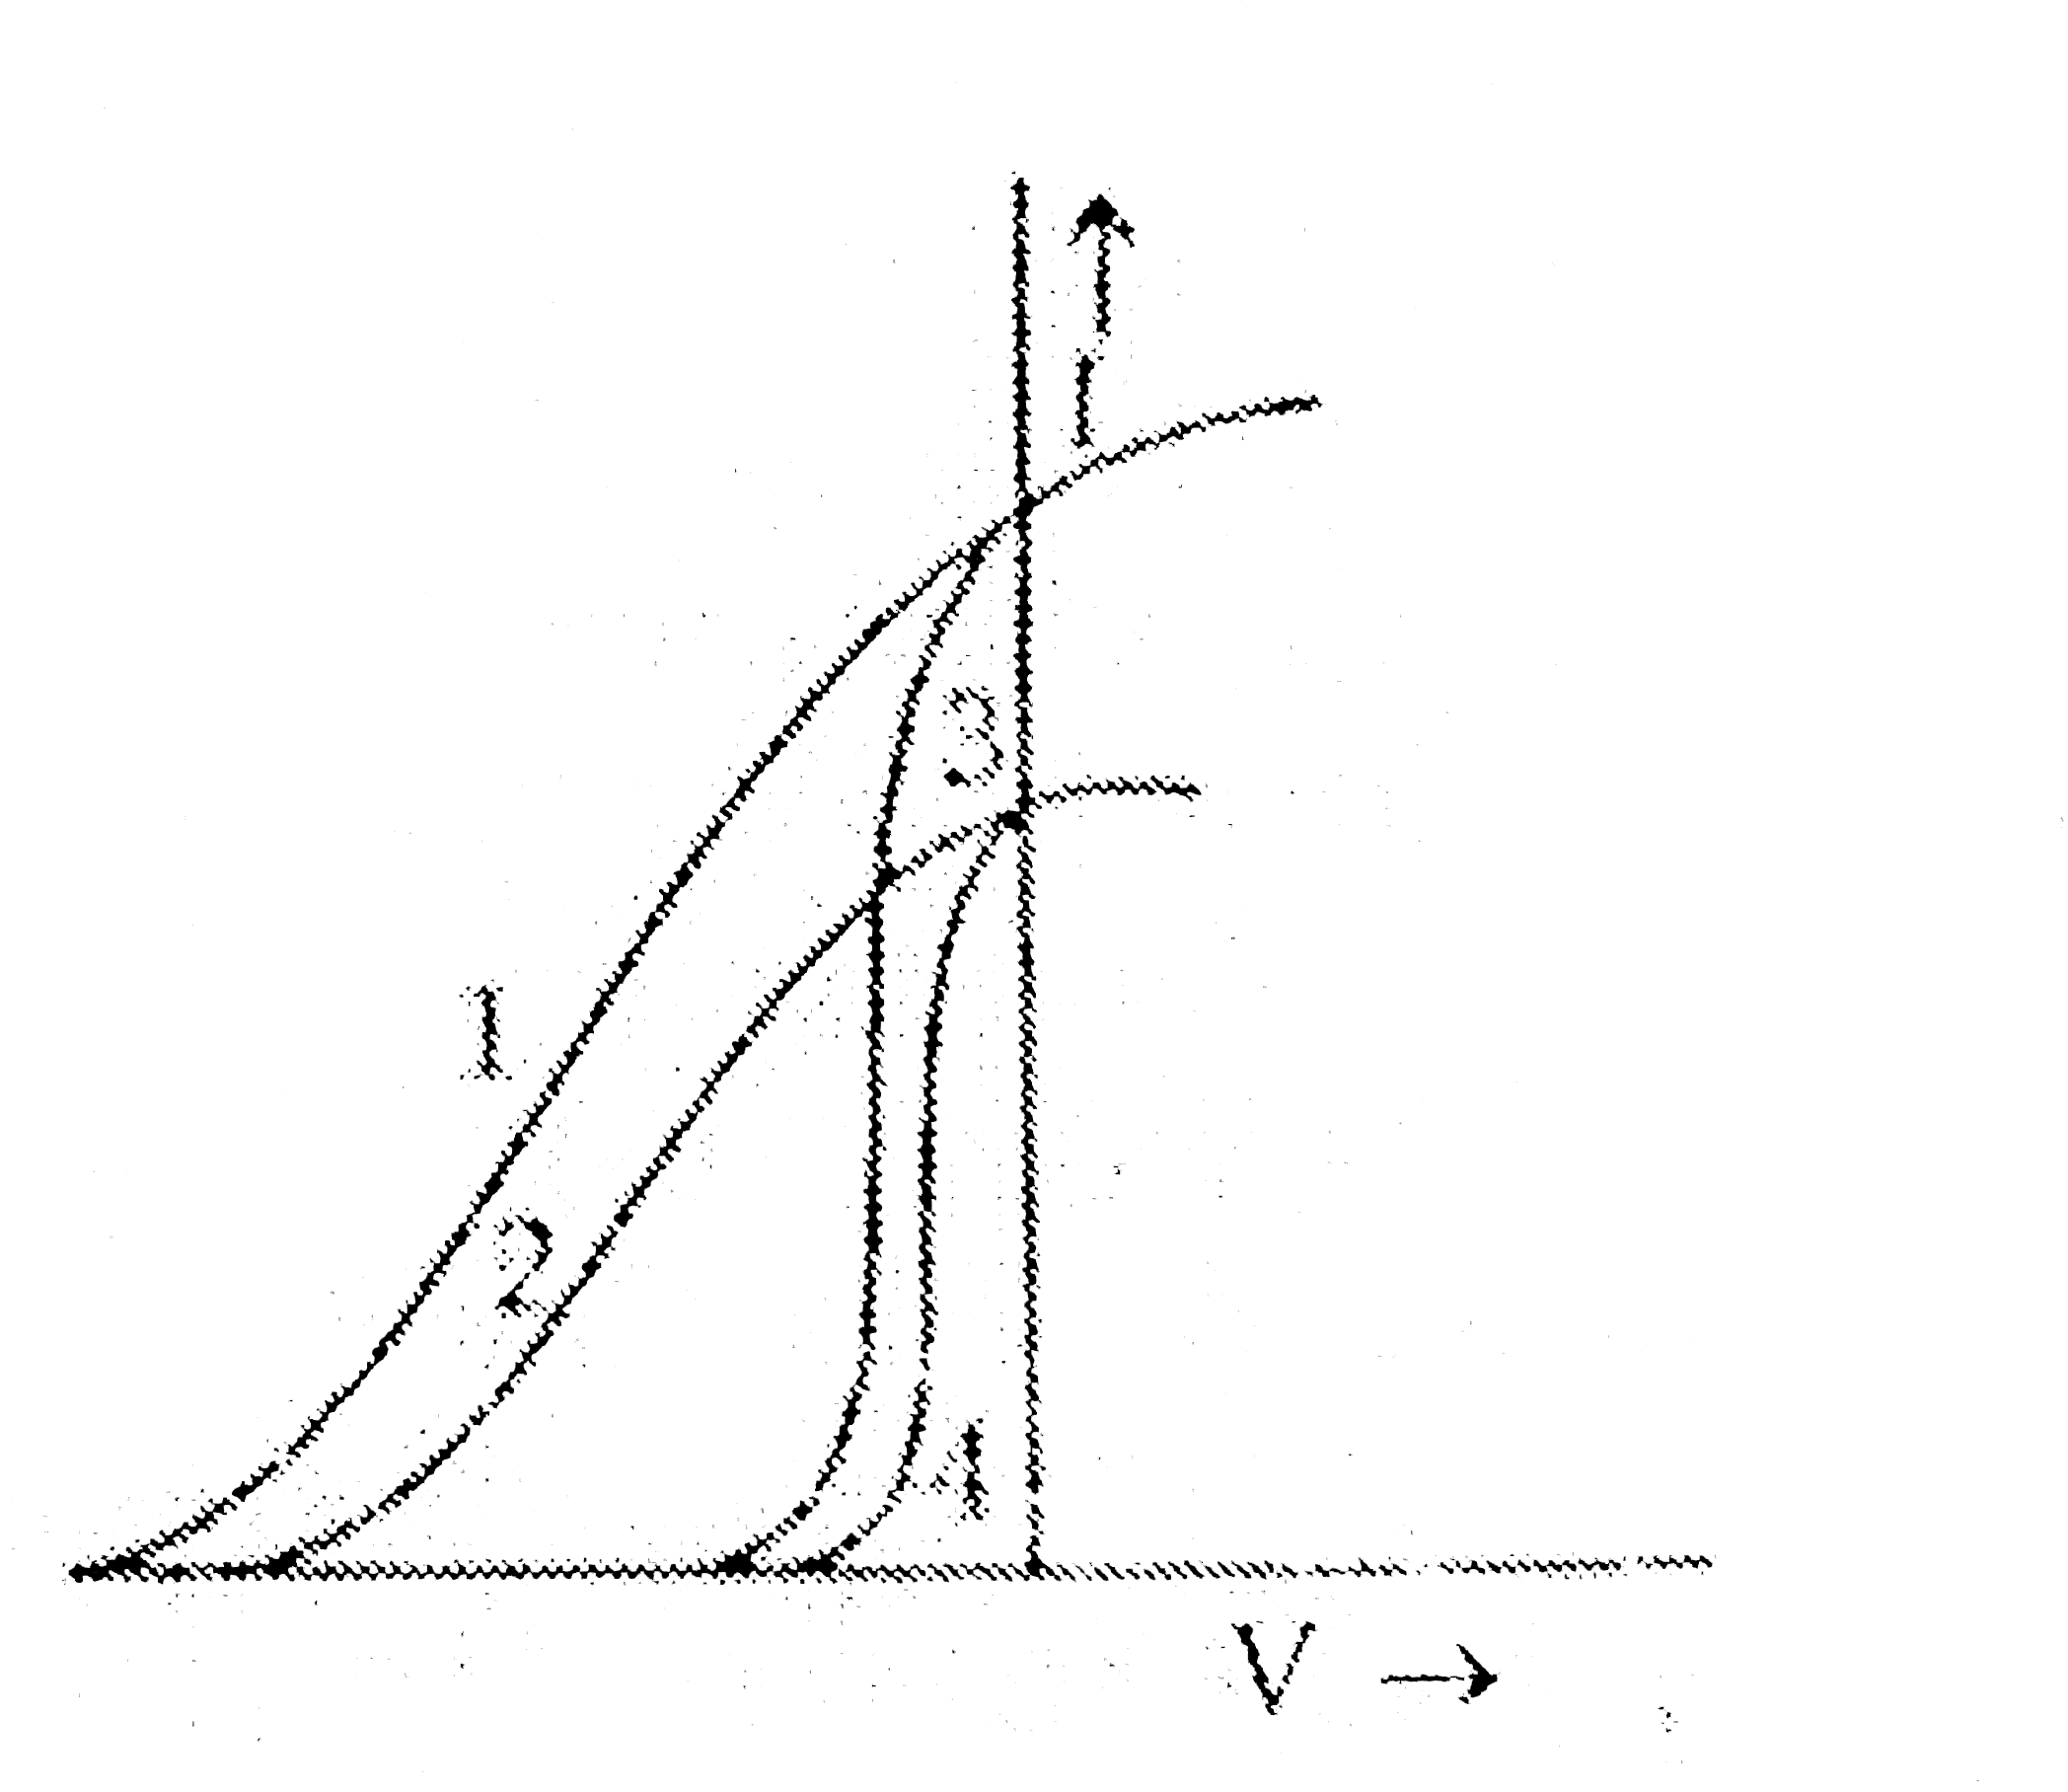
- The graph of Fig. shows the variation of photoelectric current (I) ver...
Text Solution
|
- A 10 V battery of negilgible internal resistance is connected across a...
Text Solution
|
- The emf of a cell is always greater than its terminal voltage. Why? Gi...
Text Solution
|
- What is the relation between refractive index and critical angle for a...
Text Solution
|
- State Lenz's Law. A metallic rod held horizontally along east-west...
Text Solution
|
- A convex lens of focal length 25 cm is placed co-axially in contact wi...
Text Solution
|
- An ammeter of resistance 0*80Omega can measure current upto 1*0A. (a...
Text Solution
|
- In the given circuit diagram, a voltmeter 'V' is connected across a la...
Text Solution
|
- (a) An EM wave is travelling in a medium with a velocity vecv=vhati.Dr...
Text Solution
|
- In the given block diagram of a receiver, Figure, identify the boxes l...
Text Solution
|
- Explain, with the help of a circuit diagram, the working of a photo di...
Text Solution
|
- Mention the important considerations required while fabricating a p-n ...
Text Solution
|
- Write three important factors which justify the need of modulating a m...
Text Solution
|
- Calculate the capacity of unknown capacitance is connected acrosss a ...
Text Solution
|
- A hollow cylindrical box of length 1m and area of cross section 25 cm...
Text Solution
|
- In a typical unclear reaction, e.g. ""(1)^(2)H+""(1)^(2)H to ""(2)^(...
Text Solution
|
- (a) Why photoelectric effect cannot be explained on the basis of wave ...
Text Solution
|
- Output characteristics of an n-p-n transistor in CE configuration is s...
Text Solution
|