Text Solution
Verified by Experts


Topper's Solved these Questions
GENERAL PRINCIPLES AND PROCESSES OF ISOLATION OF ELEMENTS
OSWAAL PUBLICATION|Exercise TOPIC 1 (LONG ANSWER TYPE QUESTIONS-I)|7 VideosGENERAL PRINCIPLES AND PROCESSES OF ISOLATION OF ELEMENTS
OSWAAL PUBLICATION|Exercise TOPIC 2 (VERY SHORT ANSWER TYPE QUESTIONS)|18 VideosGENERAL PRINCIPLES AND PROCESSES OF ISOLATION OF ELEMENTS
OSWAAL PUBLICATION|Exercise TOPIC 2 (LONG ANSWER TYPE QUESTIONS-II)|2 VideosELECTRO-CHEMISTRY
OSWAAL PUBLICATION|Exercise Topic - 3 ELECTROLYSIS , LAWS OF ELECTROLYSIS, BATTERIES, FUEL CELLS AND CORROSION (LONG ANSWER TYPE QUESTIONS)|4 VideosHALOALKANES & HALOARENES
OSWAAL PUBLICATION|Exercise Topic 2 (Properties of Haloarenes and Haloalkanes) (Long Answer Type Questions - II)|1 Videos
Similar Questions
Explore conceptually related problems
OSWAAL PUBLICATION-GENERAL PRINCIPLES AND PROCESSES OF ISOLATION OF ELEMENTS -TOPIC 1 (SHORT ANSWER TYPE QUESTIONS)
- With the help of Ellingham diagram explain why silver oxide can be dec...
Text Solution
|
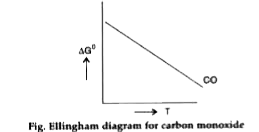
- Draw the Ellingham diagram for the formation of carbon monoxide with t...
Text Solution
|
- Giving examples differentiate between 'roasting' and 'calcination'
Text Solution
|
- What should be the considerations during the extraction of metals by e...
Text Solution
|
- What is the role of flux in metallurgical processes?
Text Solution
|
- How are the metals used as semiconductor, refined? What is the princip...
Text Solution
|
- What is slag?
Text Solution
|
- Copper can be extracted by hydrometallurgy but not zinc. Explain.
Text Solution
|
- What is the role of depressant (NaCN) in Froth-Flotation method?
Text Solution
|
- Explain with equation Van-Arkel method for refining of zircnium.
Text Solution
|