Text Solution
Verified by Experts


Topper's Solved these Questions
XII BOARDS
XII BOARD PREVIOUS YEAR PAPER ENGLISH|Exercise SET - I SECTION D|8 VideosXII BOARDS
XII BOARD PREVIOUS YEAR PAPER ENGLISH|Exercise DELHI BOARD 2016|1 VideosXII BOARDS
XII BOARD PREVIOUS YEAR PAPER ENGLISH|Exercise C.B.S.E. CLASS- XII|99 VideosSAMPLE PAPER 2019
XII BOARD PREVIOUS YEAR PAPER ENGLISH|Exercise Section E Part B|3 Videos
XII BOARD PREVIOUS YEAR PAPER ENGLISH-XII BOARDS-SET - I SECTION C
- Make a list of any three outbreeding devices that flowering plants hav...
Text Solution
|
- If implementation of better techniques and new strategies are required...
Text Solution
|
- Why is pedigree analysis done in study of human genetics ? State the c...
Text Solution
|
- Community service department of your school plans a visit to a slum ar...
Text Solution
|
- Name and describe that technique that helps in separating the DNA frag...
Text Solution
|
- Since the origin of life on Earth, there were five episodes of mass ex...
Text Solution
|
- Make a list of any three outbreeding devices that flowering plants hav...
Text Solution
|
- If implementation of better techniques and new straitegies are require...
Text Solution
|
- Why is pedigree analysis done in study of human genetics ? State the c...
Text Solution
|
- Community service department of your school plans a visit to a slum ar...
Text Solution
|
- Identify a, b, c, d, e and f in the table given below :
Text Solution
|
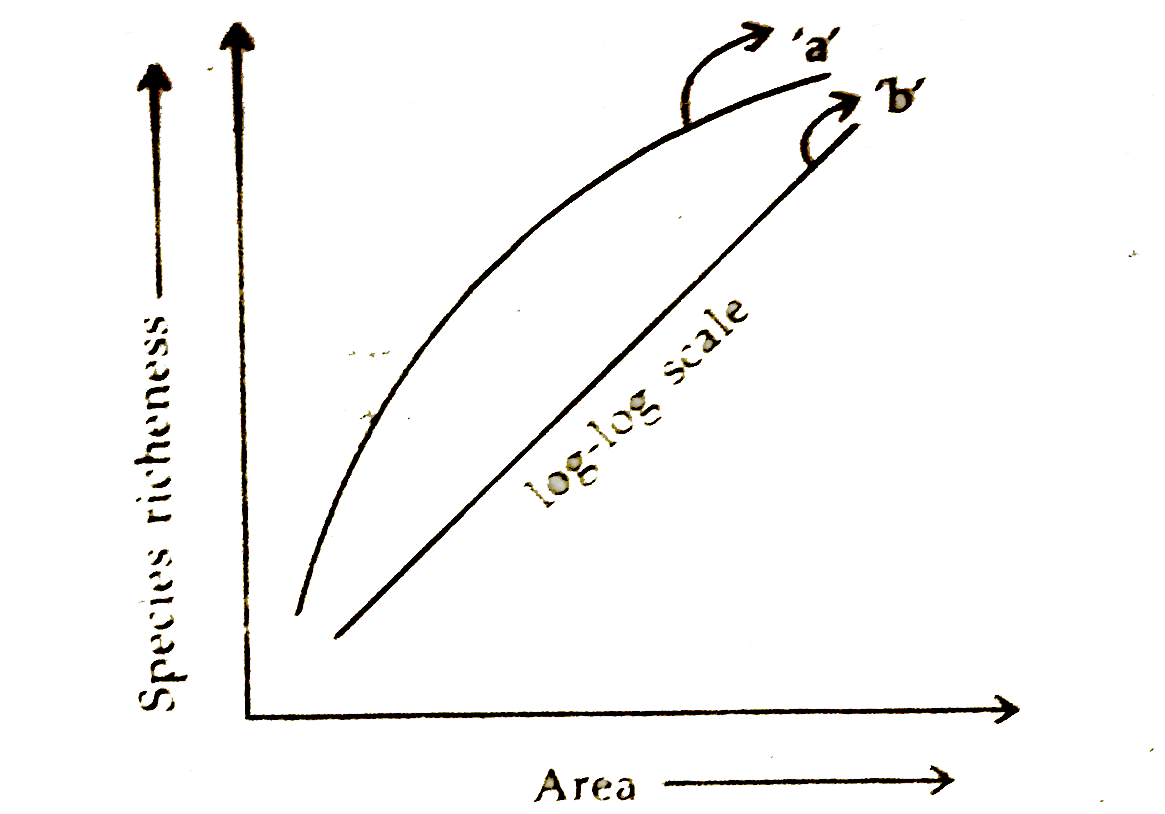
- The following graph shows the species area relationship. Answers the Q...
Text Solution
|
- Name and describe that technique that helps in separating the DNA frag...
Text Solution
|
- Since the origin of life on Earth, there were five episodes of mass ex...
Text Solution
|