Home
Class 10
MATHS
The following table gives the distribut...

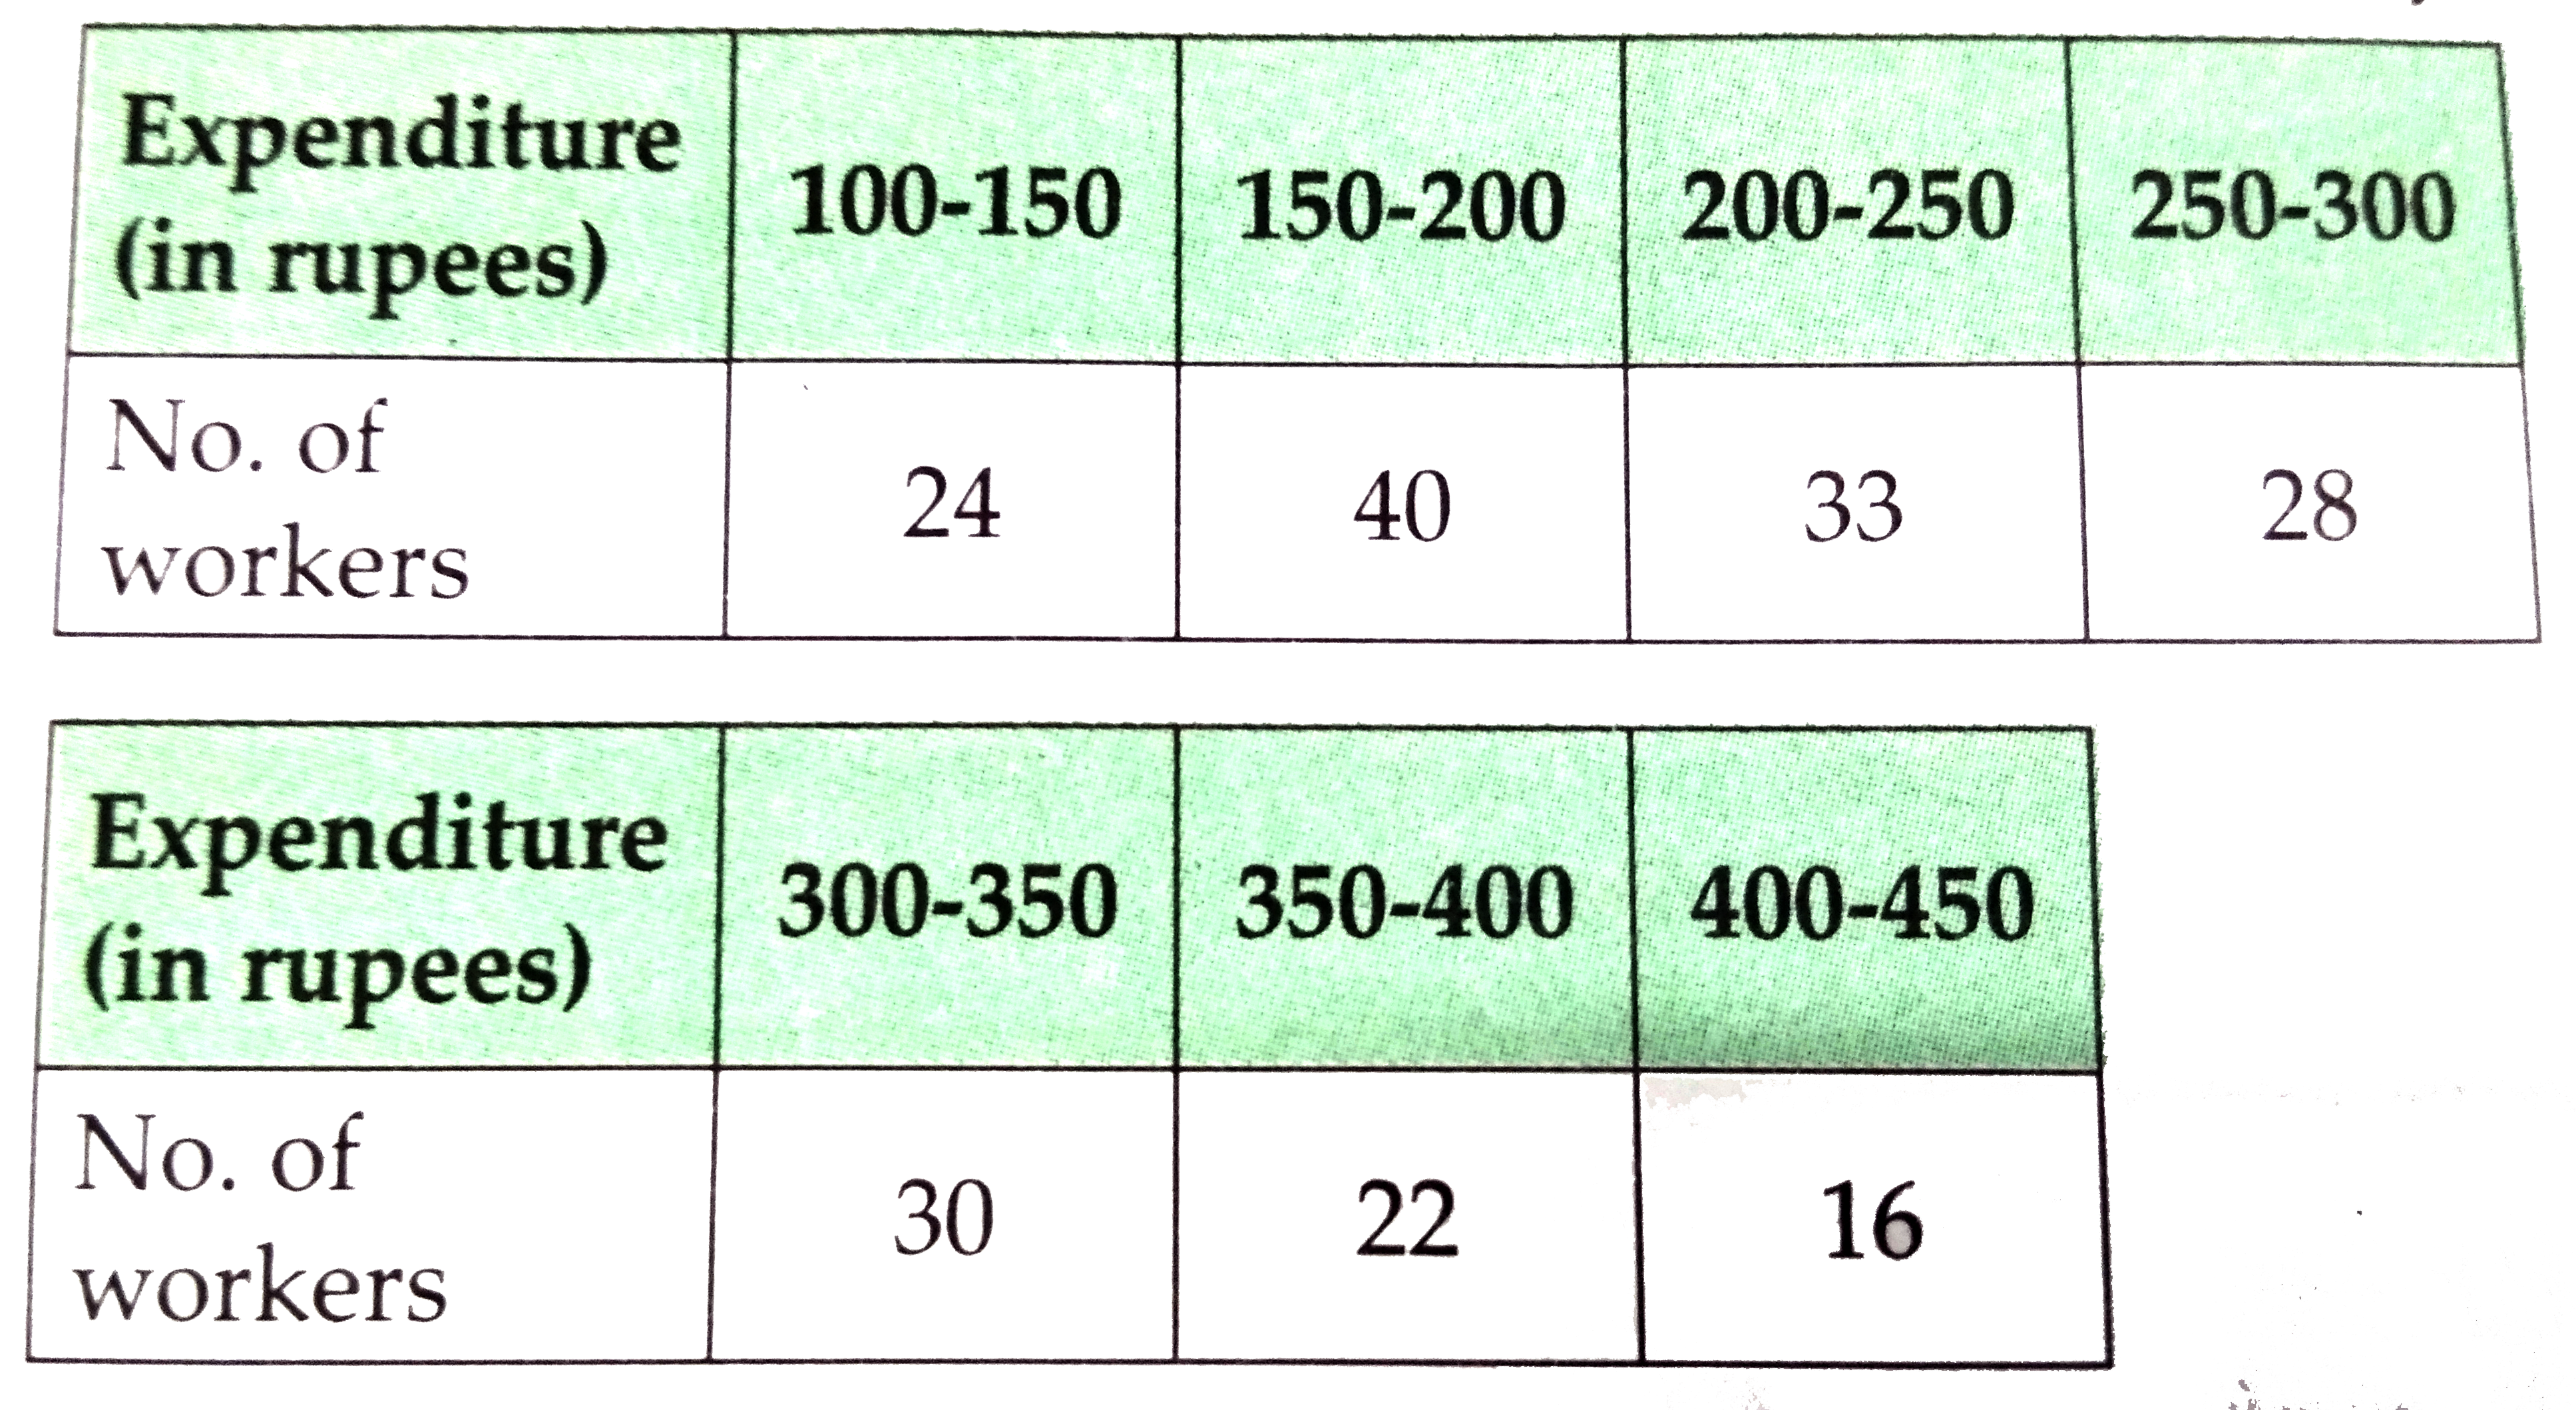
The following table gives the distribution of total household expenditure (in rupee) of workers in a city.

Find the mean expenses per household by step deviation method .

Text Solution

Verified by Experts

The correct Answer is:
152.89
Promotional Banner

Topper's Solved these Questions

  • STATISTICS

    NCERT TAMIL|Exercise Exercise 14.1|8 Videos
  • STATISTICS

    NCERT TAMIL|Exercise Exercise 14.2|6 Videos
  • SIMILAR TRIANGLES

    NCERT TAMIL|Exercise TRY THIS|5 Videos
  • STATISTICS AND PROBABILITY

    NCERT TAMIL|Exercise UNIT EXERCISE |12 Videos

Similar Questions

Explore conceptually related problems

The following table gives the information of frequency distribution of weekly wages of 150 workers of a company . Find the mean of the weekly wages by deviation method.

The formula to find mean by step deviation method is

Find the Arithmetic Mean of the following data using Step Deviation Method.

Calculate the Arithmetic mean of the following data using step deviation method.

A frequency distribution table for the production of oranges of some farm owners is given below . Find the mean production of oranhes by assmed mean method .

Following table shows frequency distribution of no. of rooms occupied in a hotal per day . Find the median no. of rooms occupied in a hotal per day .

The following table shows the number of students and the time they utilized daily for their studies . Find the mean time spent by students for their studies by direct method.

In the following table , the toll paid by drivers and the number of vehicles is shown . Find the mean of the toll by assumed mean method .

The following frequency distribution table gives the ages of 200 patients treated in a hospital in a week . Find the mode of ages of the patients.

The following frequency distribution table gives the ages of 200 patients treated in a hospital in a week . Find the mode of ages of the patients.