A
B
C
D
Text Solution
AI Generated Solution
The correct Answer is:


Topper's Solved these Questions
MECHANICAL PROPERTIES OF FLUIDS
NCERT FINGERTIPS ENGLISH|Exercise Higher Order Thinking Skills|8 VideosMECHANICAL PROPERTIES OF FLUIDS
NCERT FINGERTIPS ENGLISH|Exercise Exemplar Problems|5 VideosLAWS OF MOTION
NCERT FINGERTIPS ENGLISH|Exercise Assertion And Reason|15 VideosMECHANICAL PROPERTIES OF SOLIDS
NCERT FINGERTIPS ENGLISH|Exercise Assertion And Reason|15 Videos
Similar Questions
Explore conceptually related problems
NCERT FINGERTIPS ENGLISH-MECHANICAL PROPERTIES OF FLUIDS-NCERT Exemplar
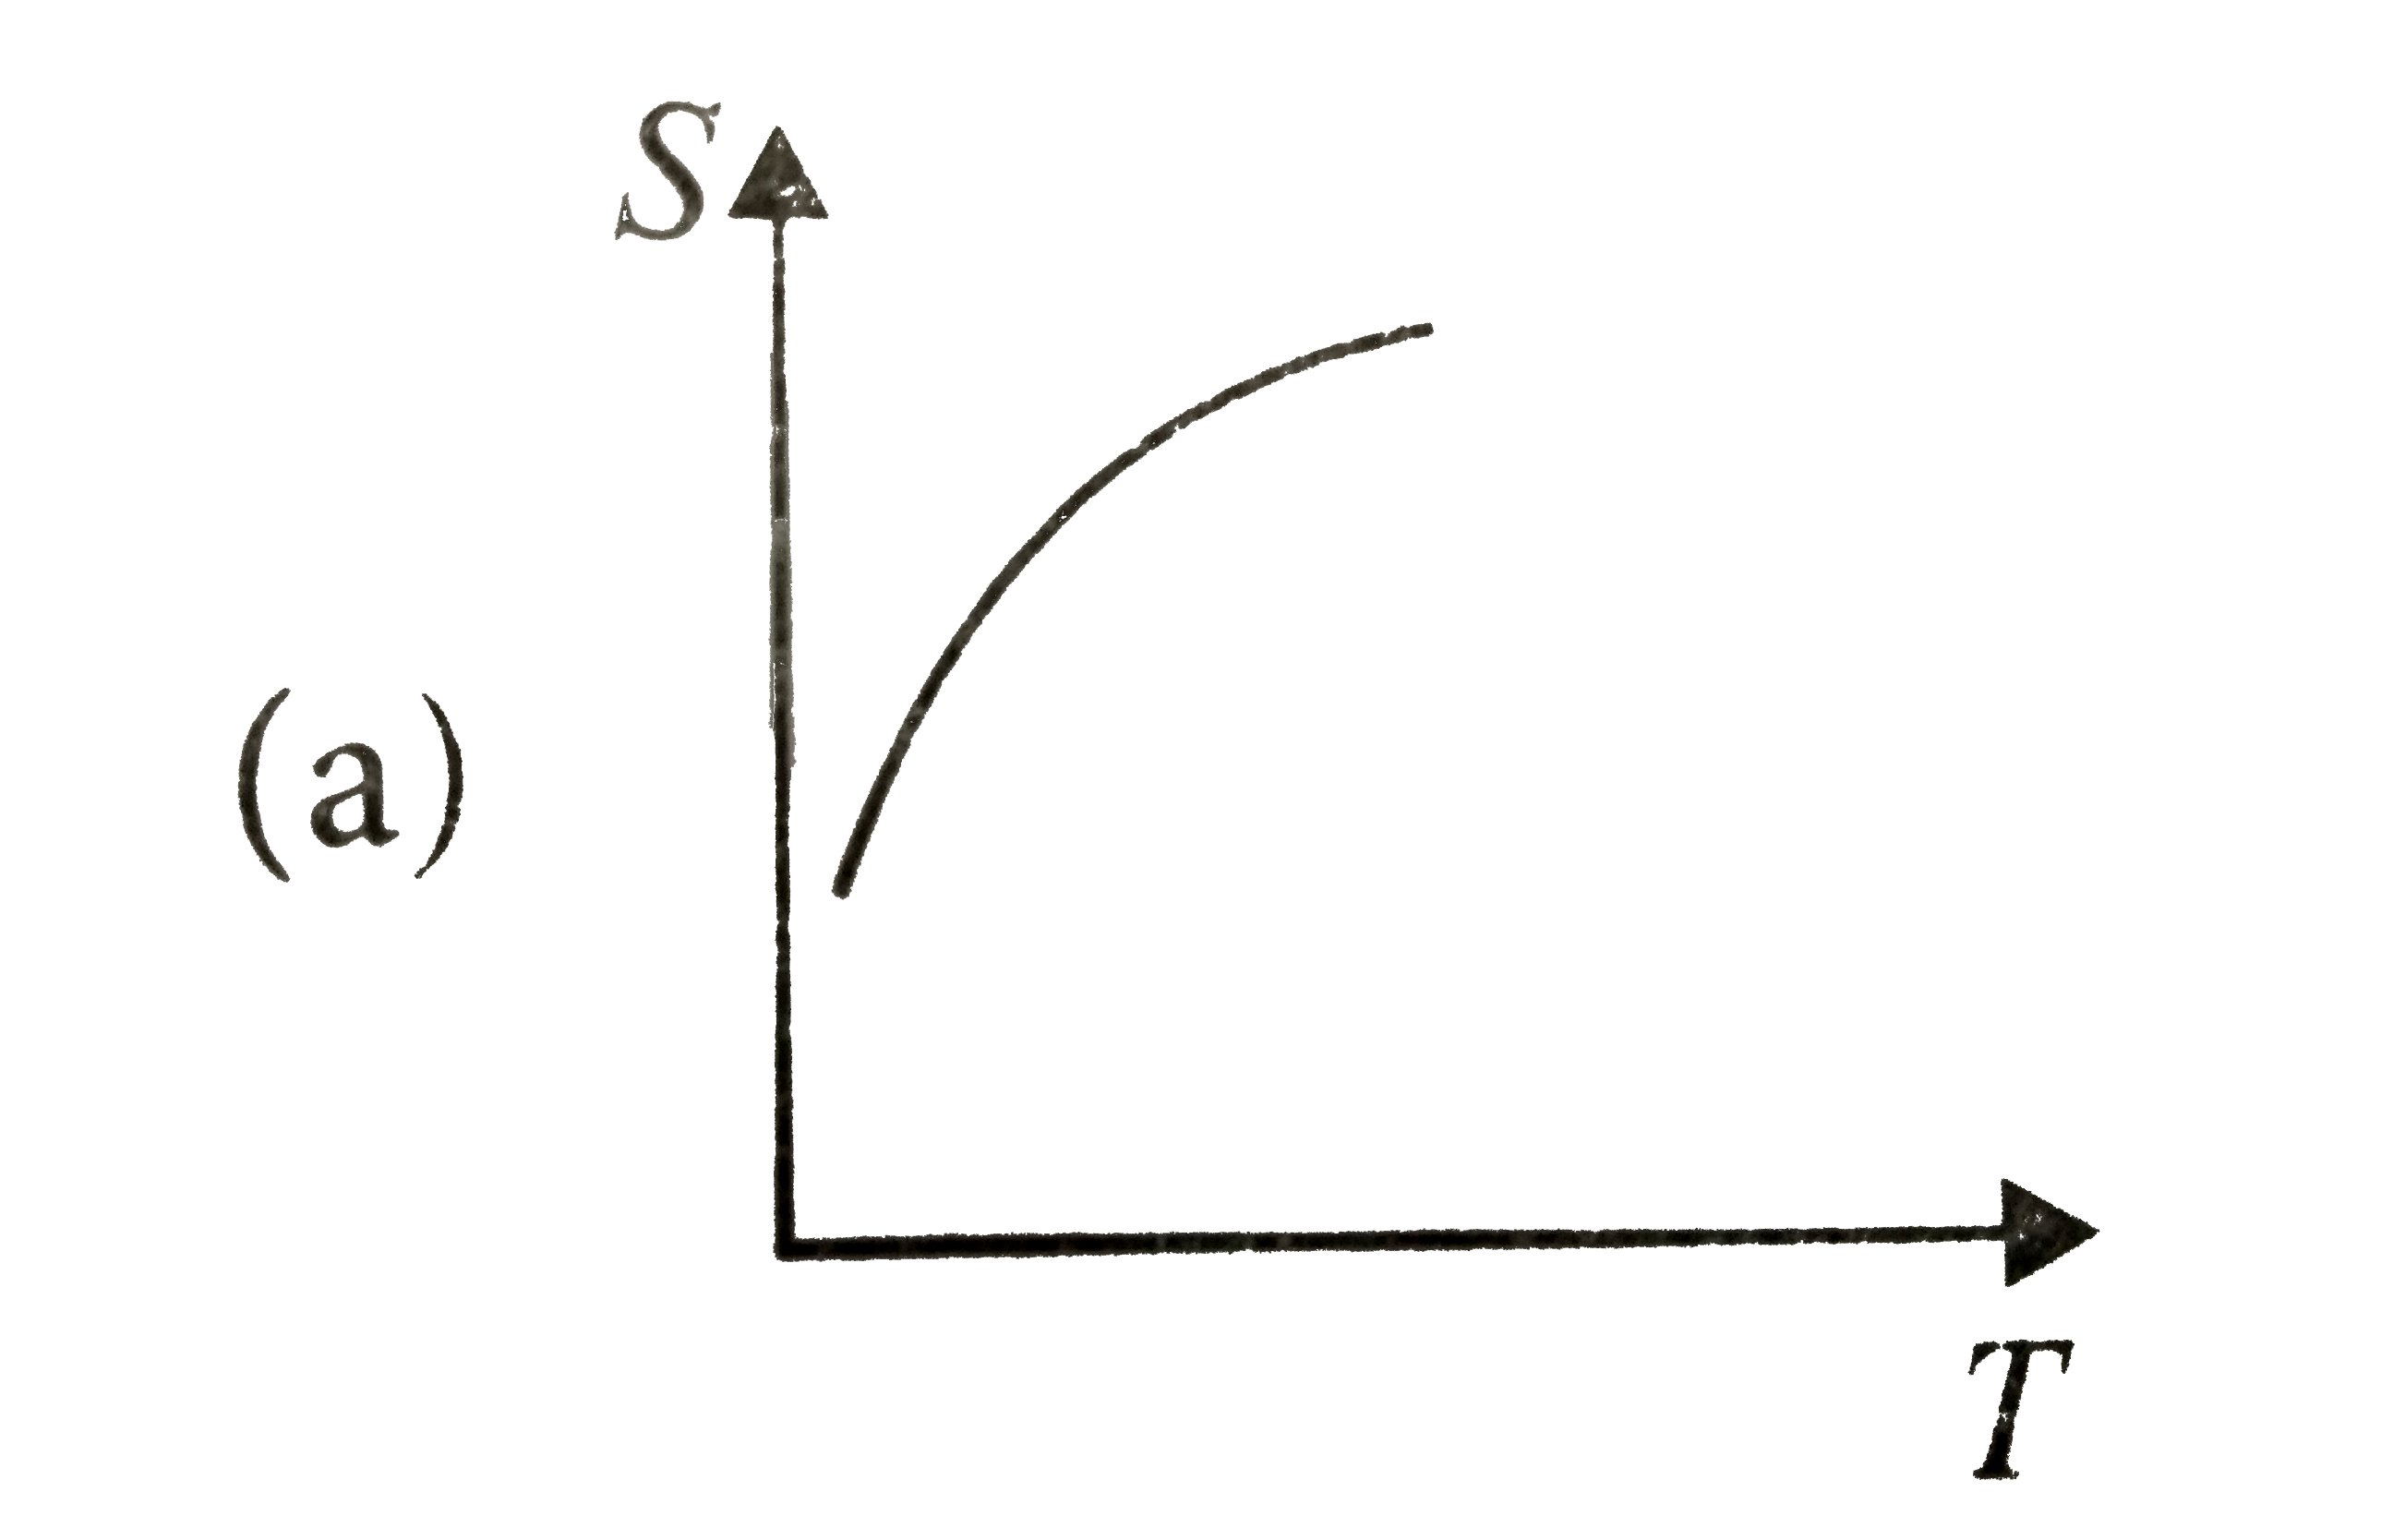
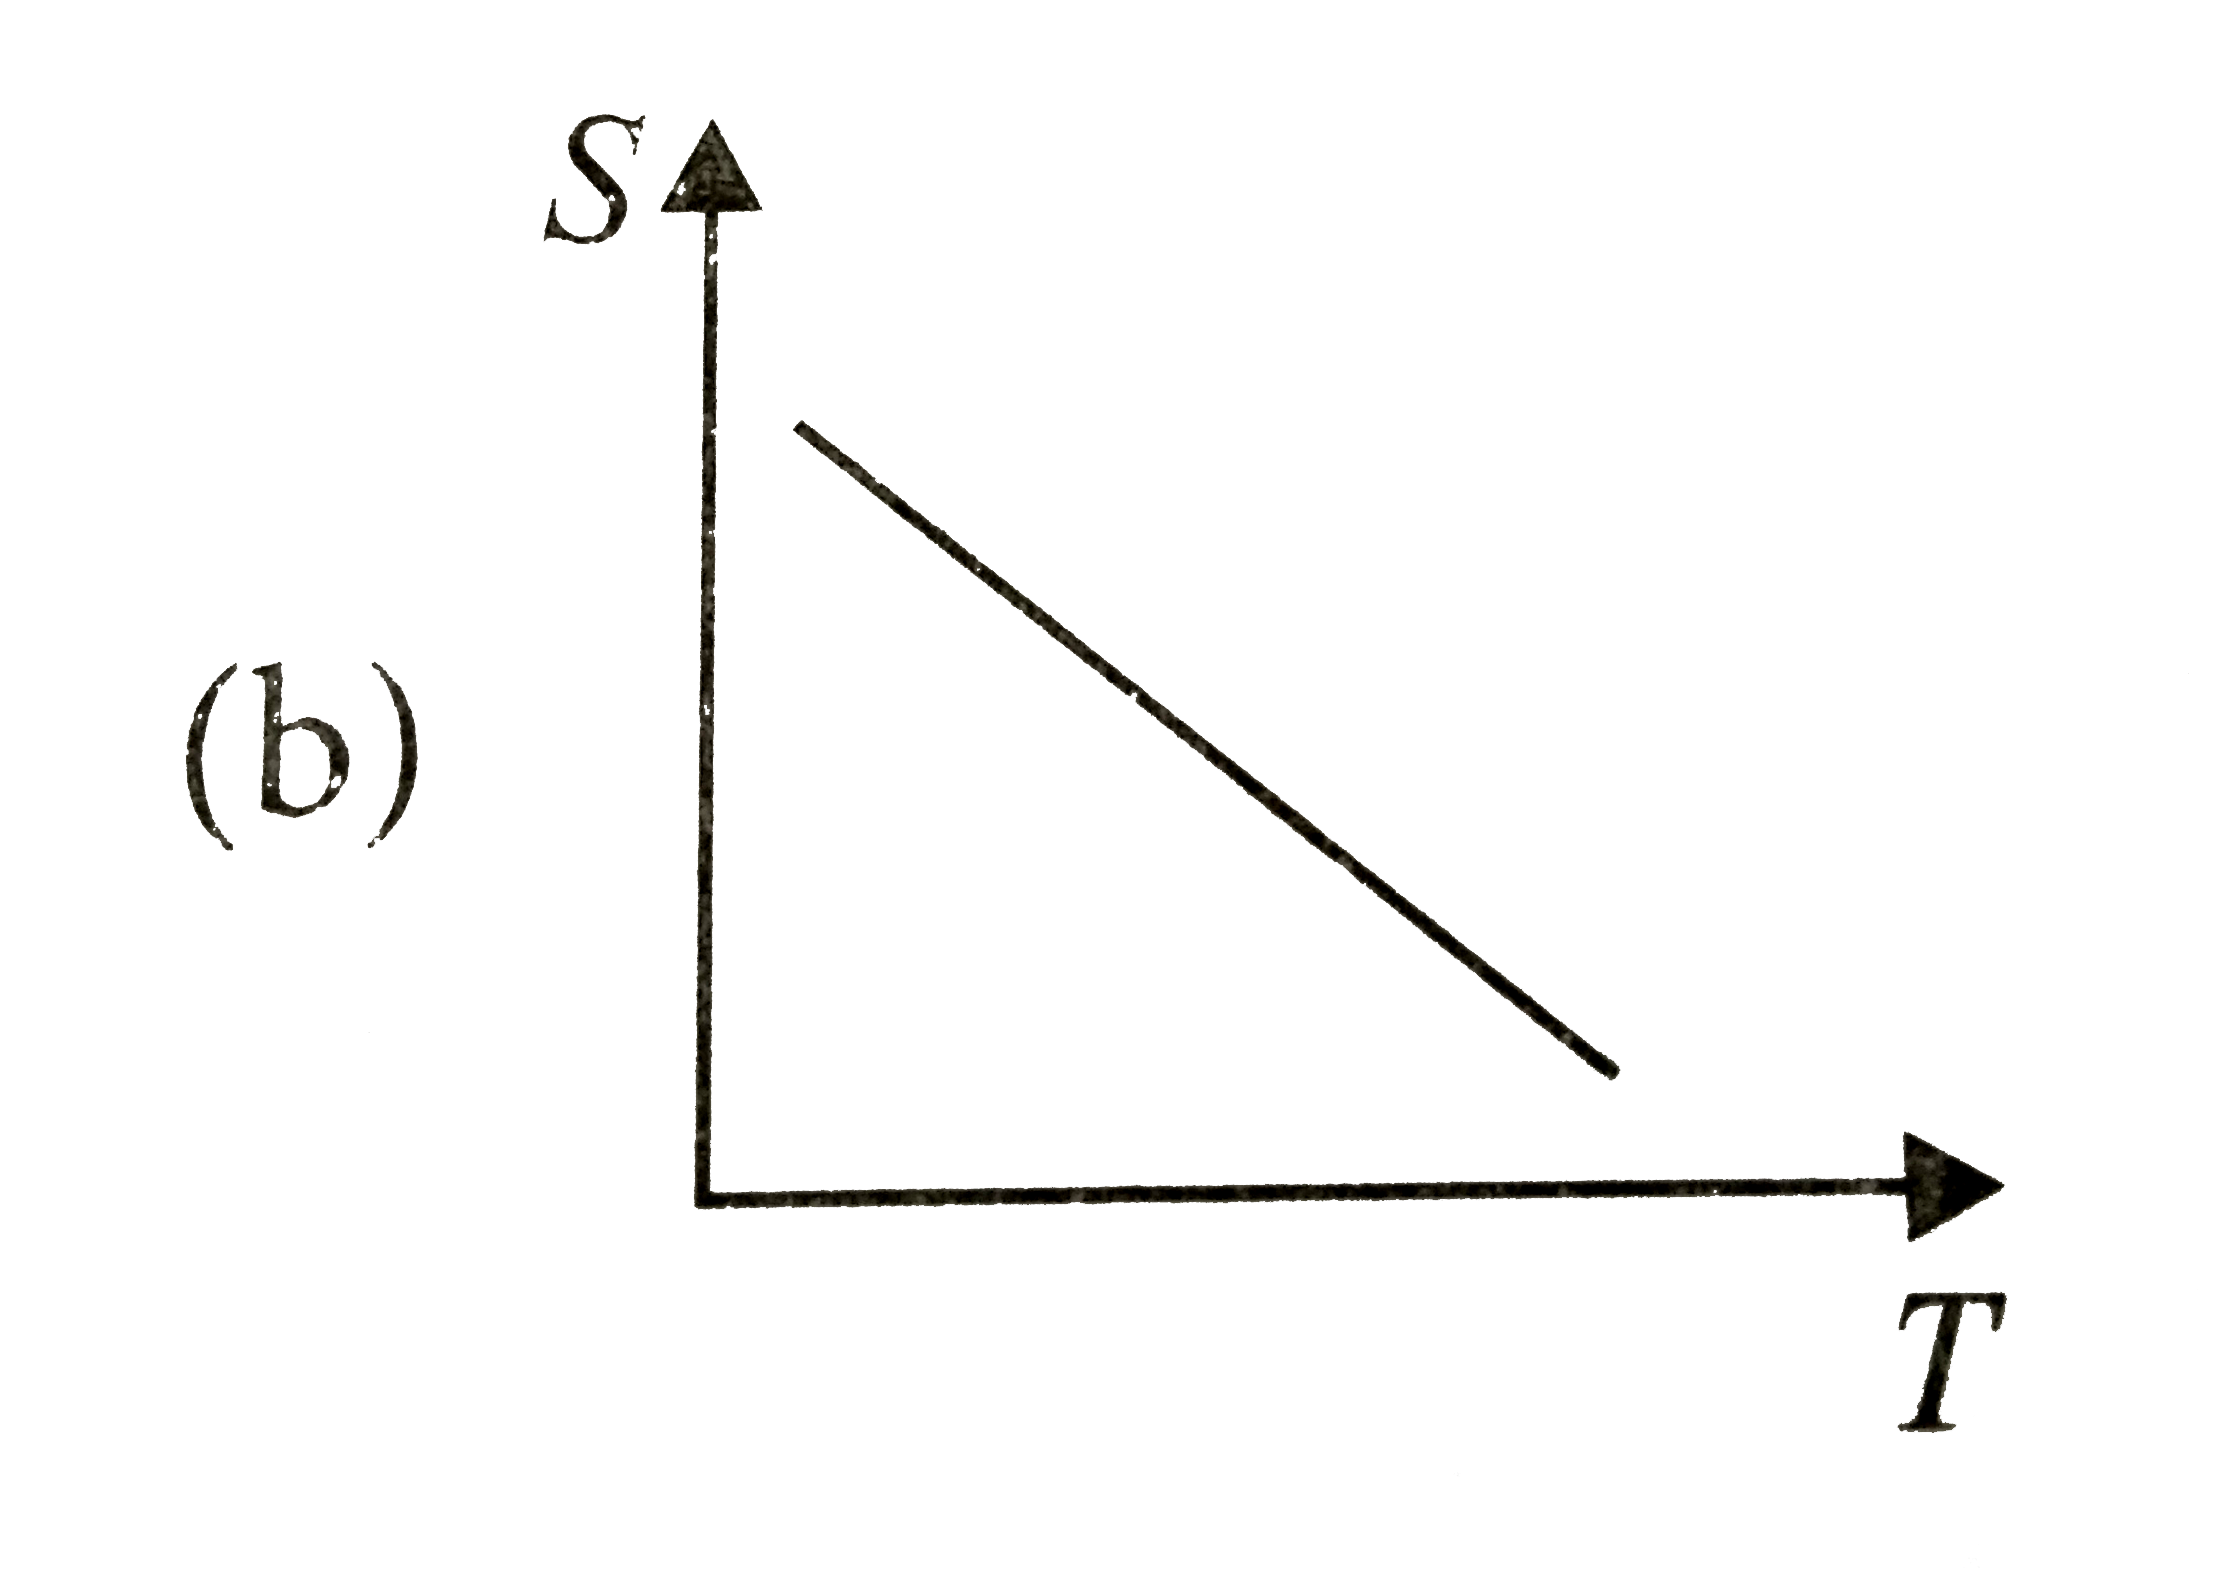
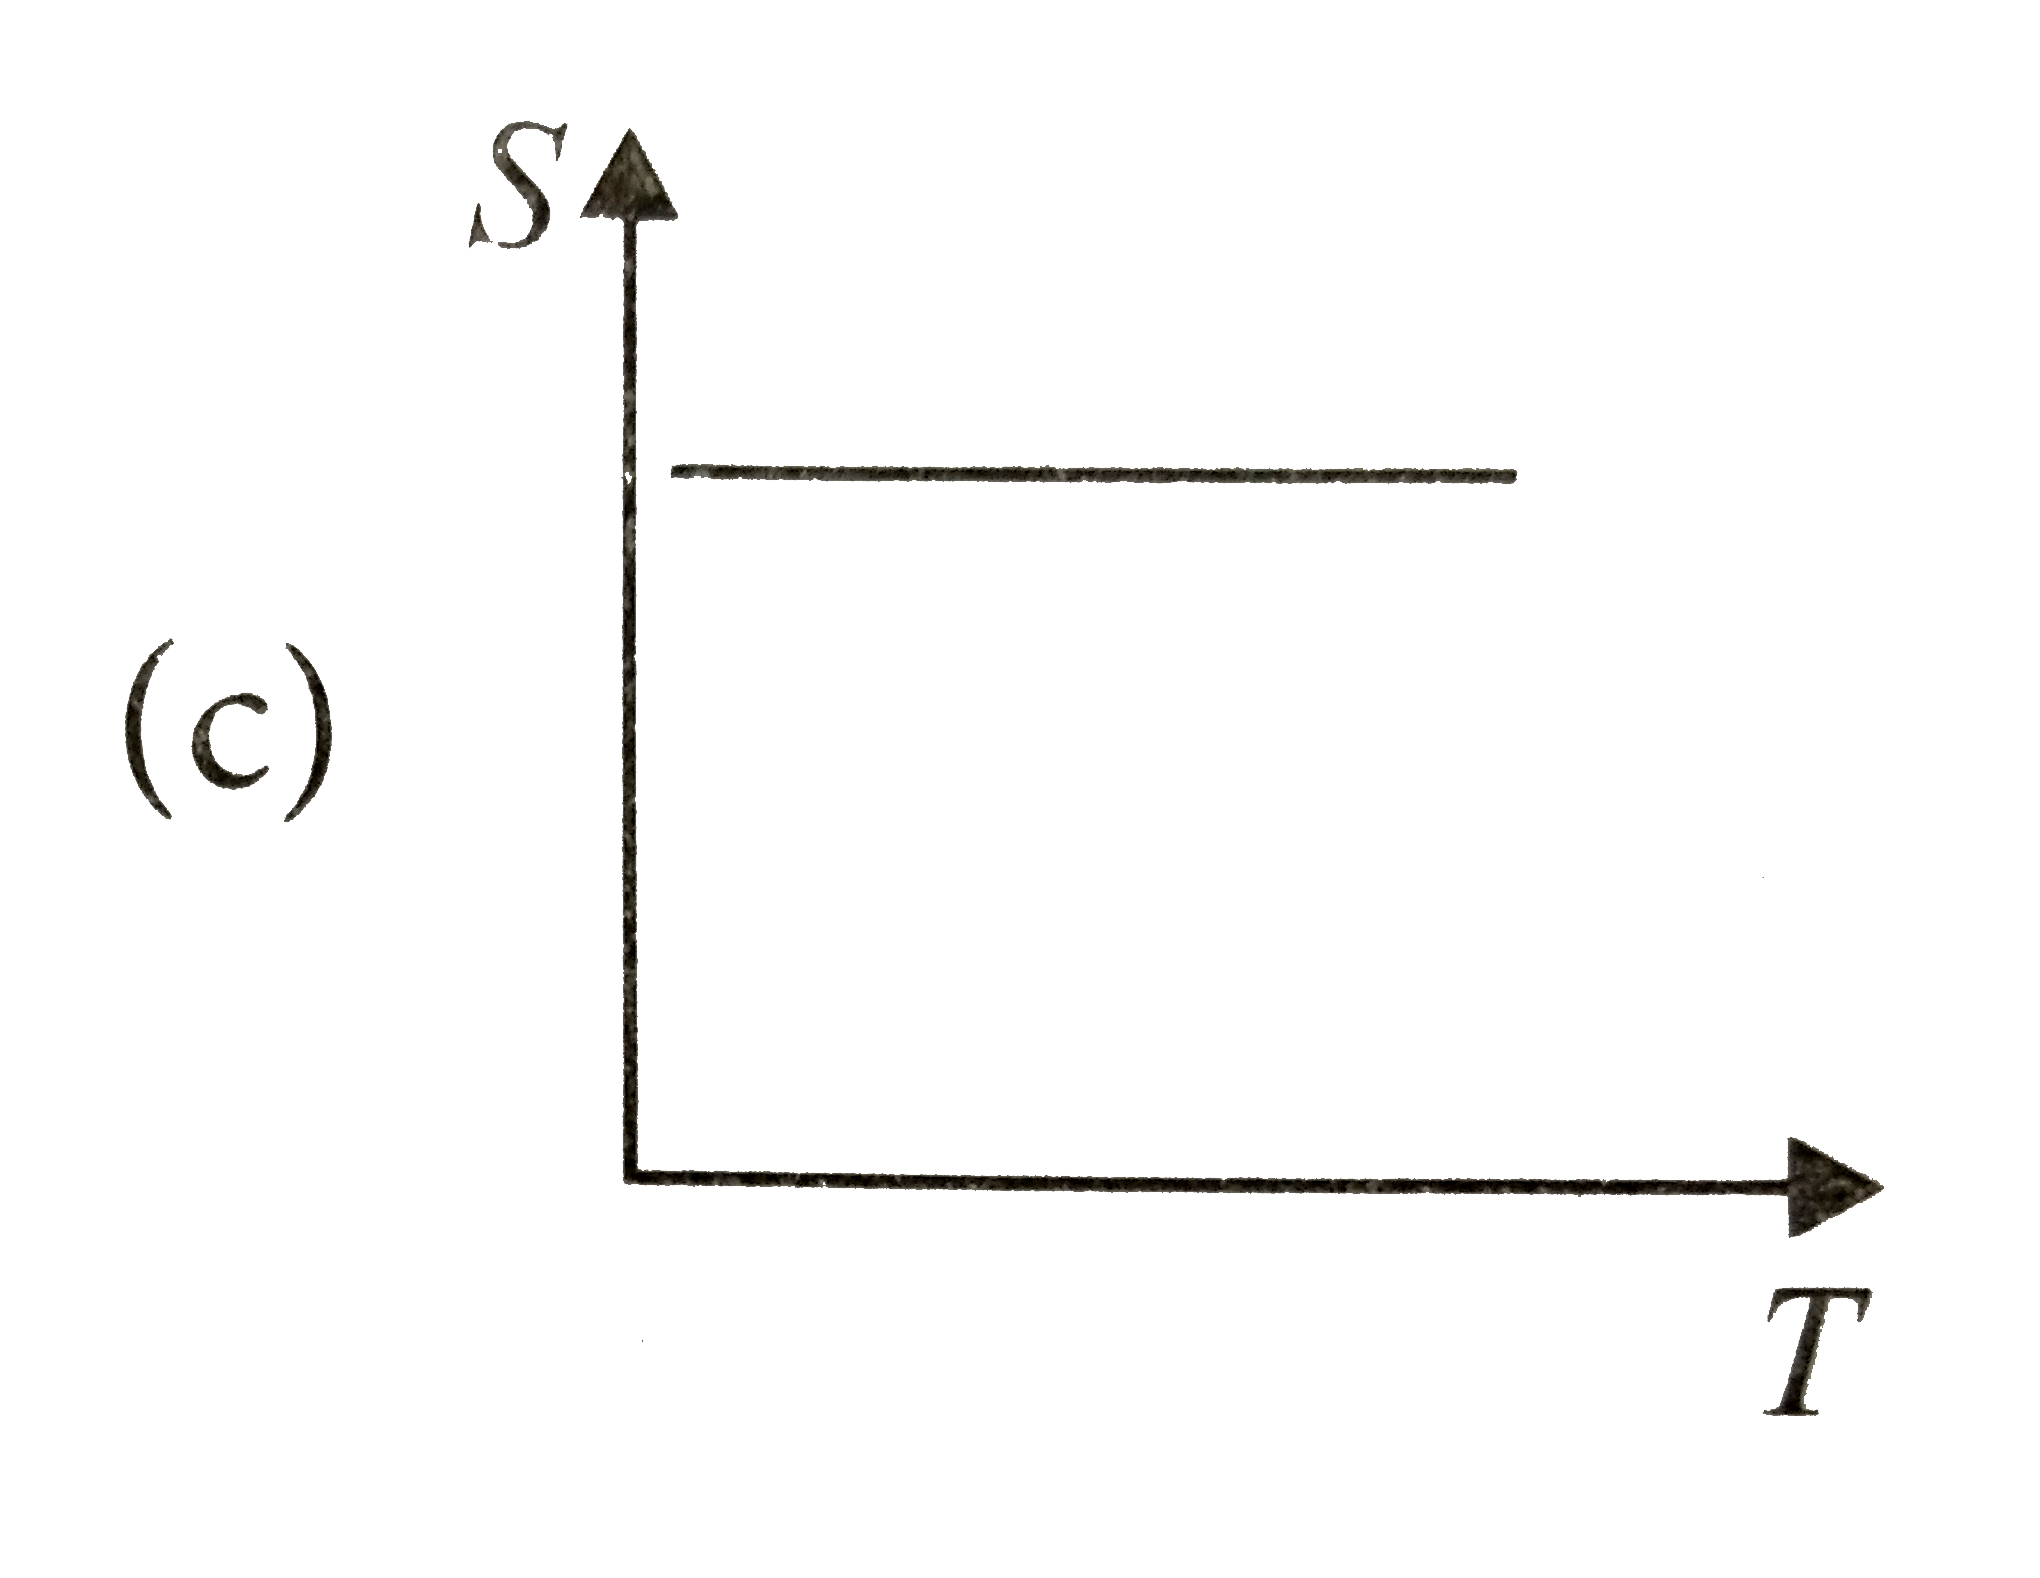
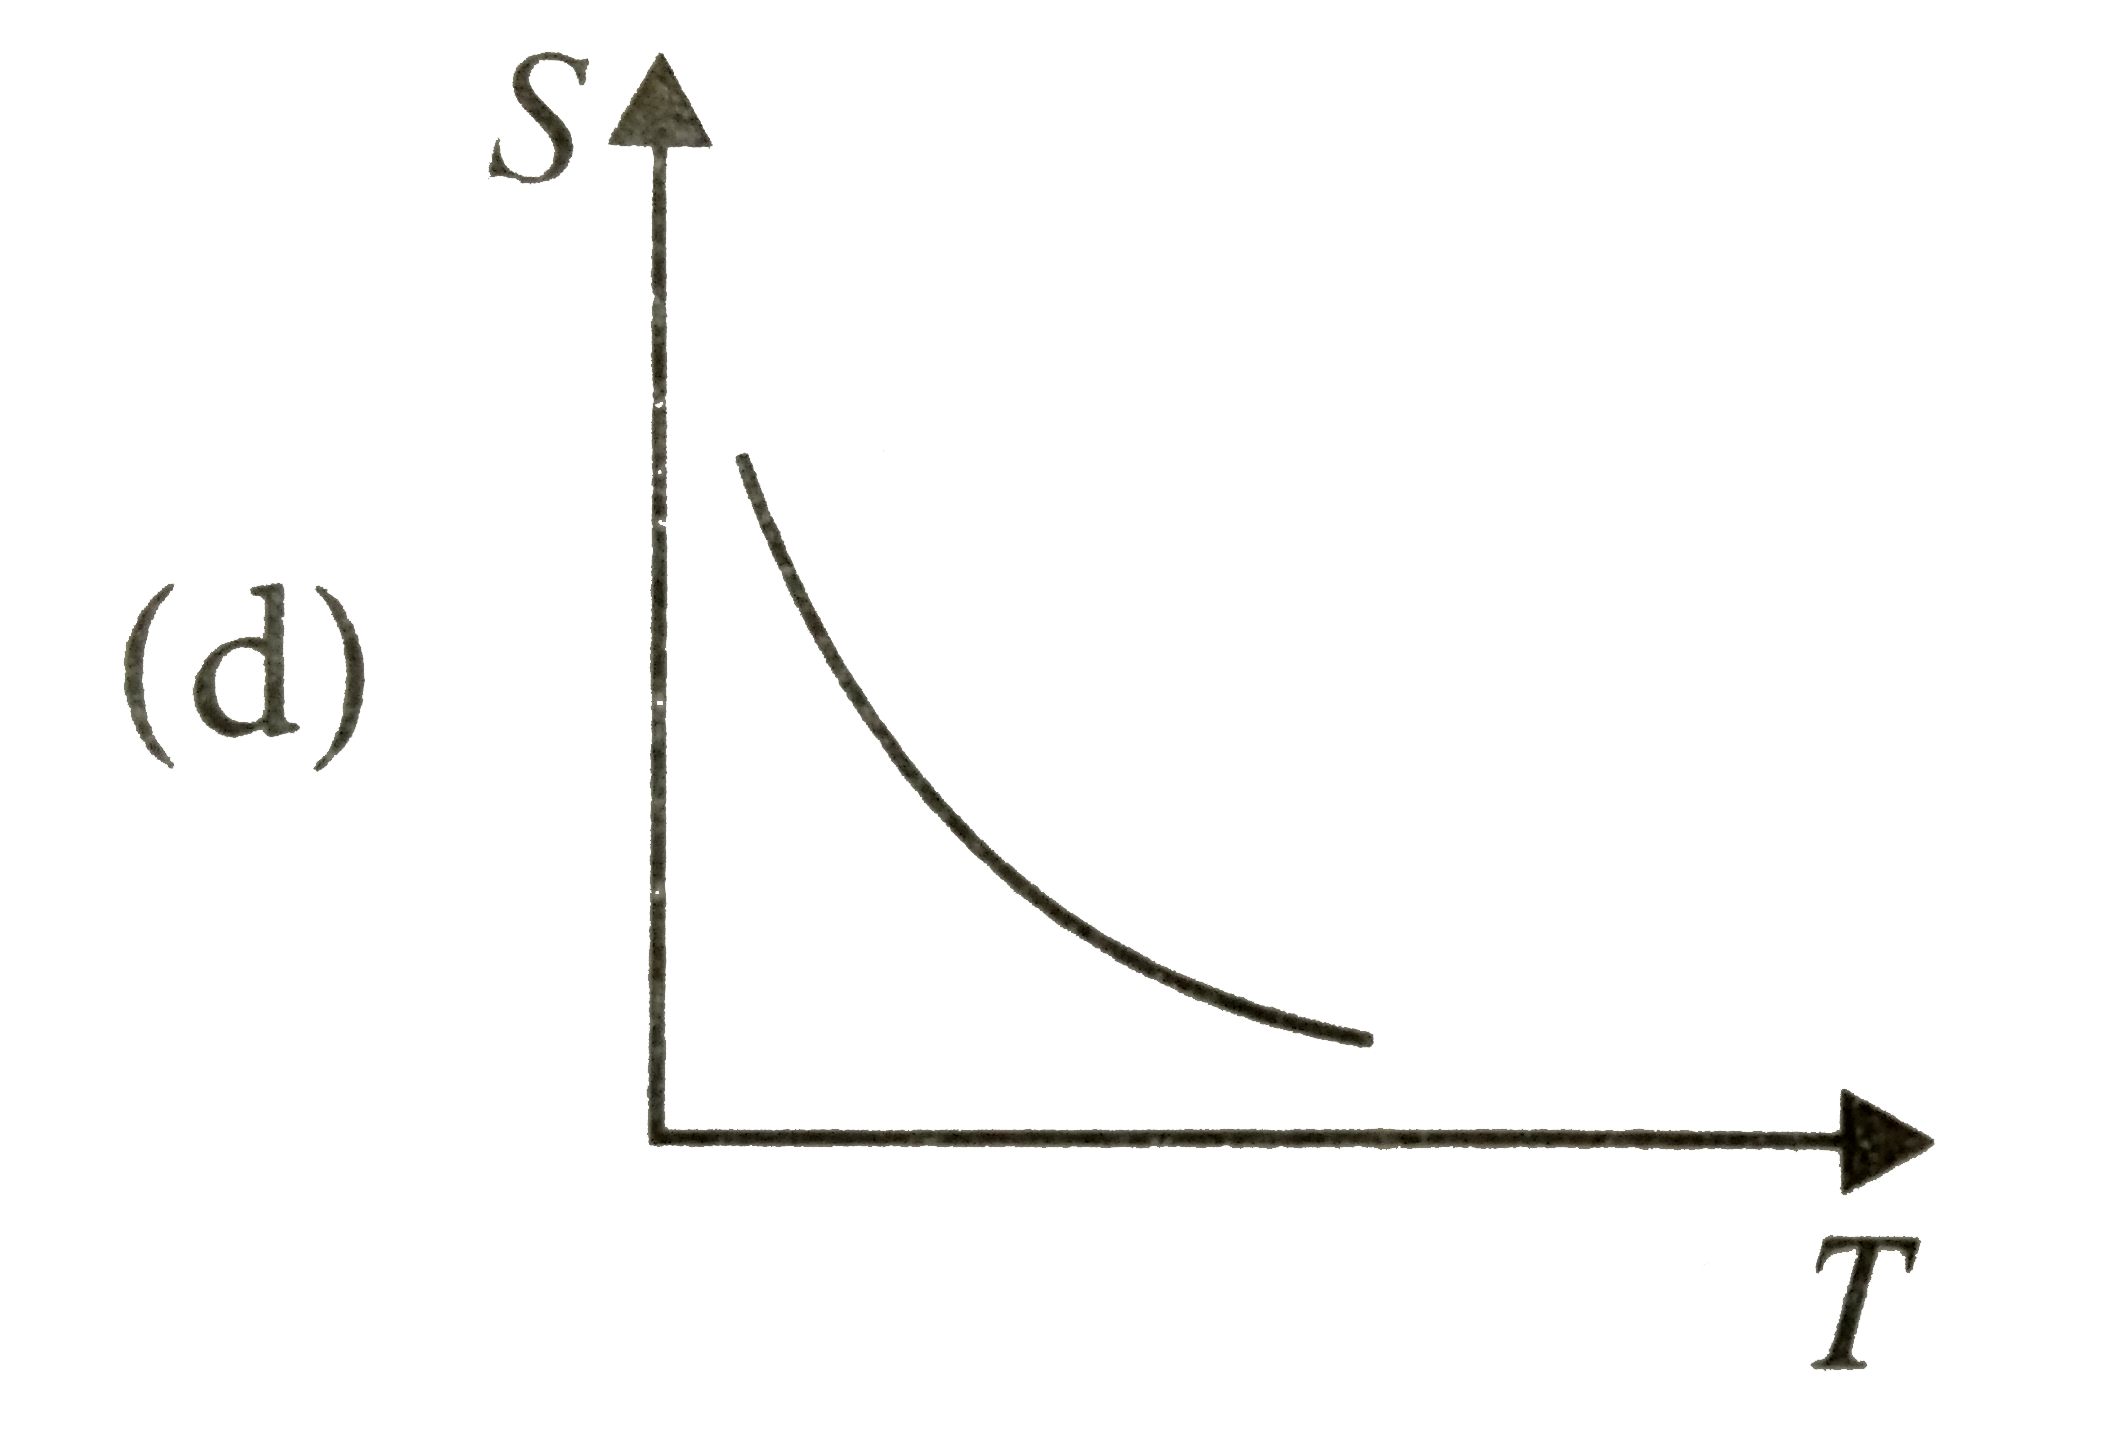
- Which graph represents the variation of surface tension with temperatu...
Text Solution
|
- A tall cylinder is filled with viscous oil. A round pebble is dropped ...
Text Solution
|
- Which of the following diagrams does not represent a streamline flow?
Text Solution
|
- Along a streamline,
Text Solution
|
- An ideal fluid flows through a pipe of circular cross-section made of ...
Text Solution
|
- The angle of contact at the interface of water glass is 0^(@) ethylalc...
Text Solution
|