Home
Class 9
PHYSICS
Fig. 2.36 shows the displacement-time gr...

Fig. 2.36 shows the displacement-time graph for four bodies A, B, C and D. In each case state what information do you get about the acceleration (zero, positive or negative).

Text Solution

Verified by Experts

A : Zero acceleration since slope (i.e., velocity) is constant, B : zero acceleration since slope is constant, C : negative acceleration (or retardation) since slope is decreasing with time, D: positive acceleration since slope is increasing with time.
Promotional Banner

Topper's Solved these Questions

  • MOTION IN ONE DIMENSION

    ICSE|Exercise EXERCISE -2 (B) ( Multiple choice type :) |3 Videos
  • MOTION IN ONE DIMENSION

    ICSE|Exercise EXERCISE -2 (B) ( Numericals ) |12 Videos
  • MOTION IN ONE DIMENSION

    ICSE|Exercise EXERCISE -2 (A) ( Numericals ) |16 Videos
  • MEASUREMENTS AND EXPERIMENTATION

    ICSE|Exercise TOPIC 2 SIMPLE PENDULUM (4 Marks Questions ) |1 Videos
  • PRESSURE IN FLUIDS AND ATMOSPHERIC PRESSURE

    ICSE|Exercise Exercise -4(B)Numericals|5 Videos

Similar Questions

Explore conceptually related problems

Fig. 2.33 shows displacement-time graph of two vehicles A and B moving along a straight road. Which vehicle is moving faster ? Give reason.

The diagram (Fig. 2.6) below shows the pattern of the oil on the road, dripping at a constant rate from a moving car. What informations do you get from it about the motion of the car ?

The diagram in Fig. shows the displacement time graph of a vibrating body. What happens to the vibrations of the body after some time?

Fig 2.35 shows the velocity-time graph for two cars A and B moving in same direction. Which car has the greater acceleration ? Give reason to your answer. Reason: Slope of straight line for car B is more than that of line A. https://haygot.s3.amazonaws.com/questions/202728_8d7544af7b20492cb472c5b5c8c57e3d.png

Fig. 2.37 (a) shows the displacement-time graph for the motion of a body. Use it to calculate the velocity of body at t = 1 s, 2 s and 3 s, then draw the velocitytime graph for it in Fig. (b).

The figure shows position time graph of two riders C and D. Based on the information represented by the graph, answer the following questions. At t = 0 s

The figure shows position time graph of two riders C and D. Based on the information represented by the graph, answer the following questions. At t = 0 s

The figure shows position time graph of two riders C and D. Based on the information represented by the graph, answer the following questions. At t = 0 s

What informations about the motion of a body are obtained from the displacement-time graph ?

The figure shows position time graph of two riders C and D. Based on the information represented by the graph, answer the following questions. At t = 10 s

ICSE-MOTION IN ONE DIMENSION -EXERCISE -2 (B)
  1. For the motion with uniform velocity, how is the distance travelled re...

    Text Solution

    |

  2. What informations about the motion of a body are obtained from the dis...

    Text Solution

    |

  3. What does the slope of a displacement-time graph represent?

    Text Solution

    |

  4. Can displacement-time sketch be parallel to the displacement axis ? Gi...

    Text Solution

    |

  5. Draw a displacement-time graph for a boy going to school with a unifor...

    Text Solution

    |

  6. State how the velocity-time graph can be used to find (i) the accelera...

    Text Solution

    |

  7. What can you say about the nature of motion of a body if its displacem...

    Text Solution

    |

  8. Fig. 2.33 shows displacement-time graph of two vehicles A and B moving...

    Text Solution

    |

  9. State the type of motion represented by the following sketches in Fig....

    Text Solution

    |

  10. Draw a velocity-time graph for a body moving with an initial velocity ...

    Text Solution

    |

  11. What does the slope of a displacement-time graph represent?

    Text Solution

    |

  12. Fig 2.35 shows the velocity-time graph for two cars A and B moving in ...

    Text Solution

    |

  13. Draw the shape of the velocity-time graph for a body moving with (a) u...

    Text Solution

    |

  14. The velocity-time graph for a uniformly retarded body is a straight li...

    Text Solution

    |

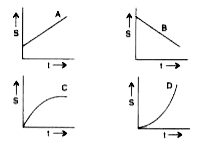
  15. Fig. 2.36 shows the displacement-time graph for four bodies A, B, C an...

    Text Solution

    |

  16. Draw a graph for acceleration against time for a uniformly accelerated...

    Text Solution

    |

  17. Draw a velocity-time graph for the free fall of a body under gravity, ...

    Text Solution

    |

  18. How is the distance related with time for the motion under uniform acc...

    Text Solution

    |

  19. A body falls freely from a certain height. Show graphically the relati...

    Text Solution

    |