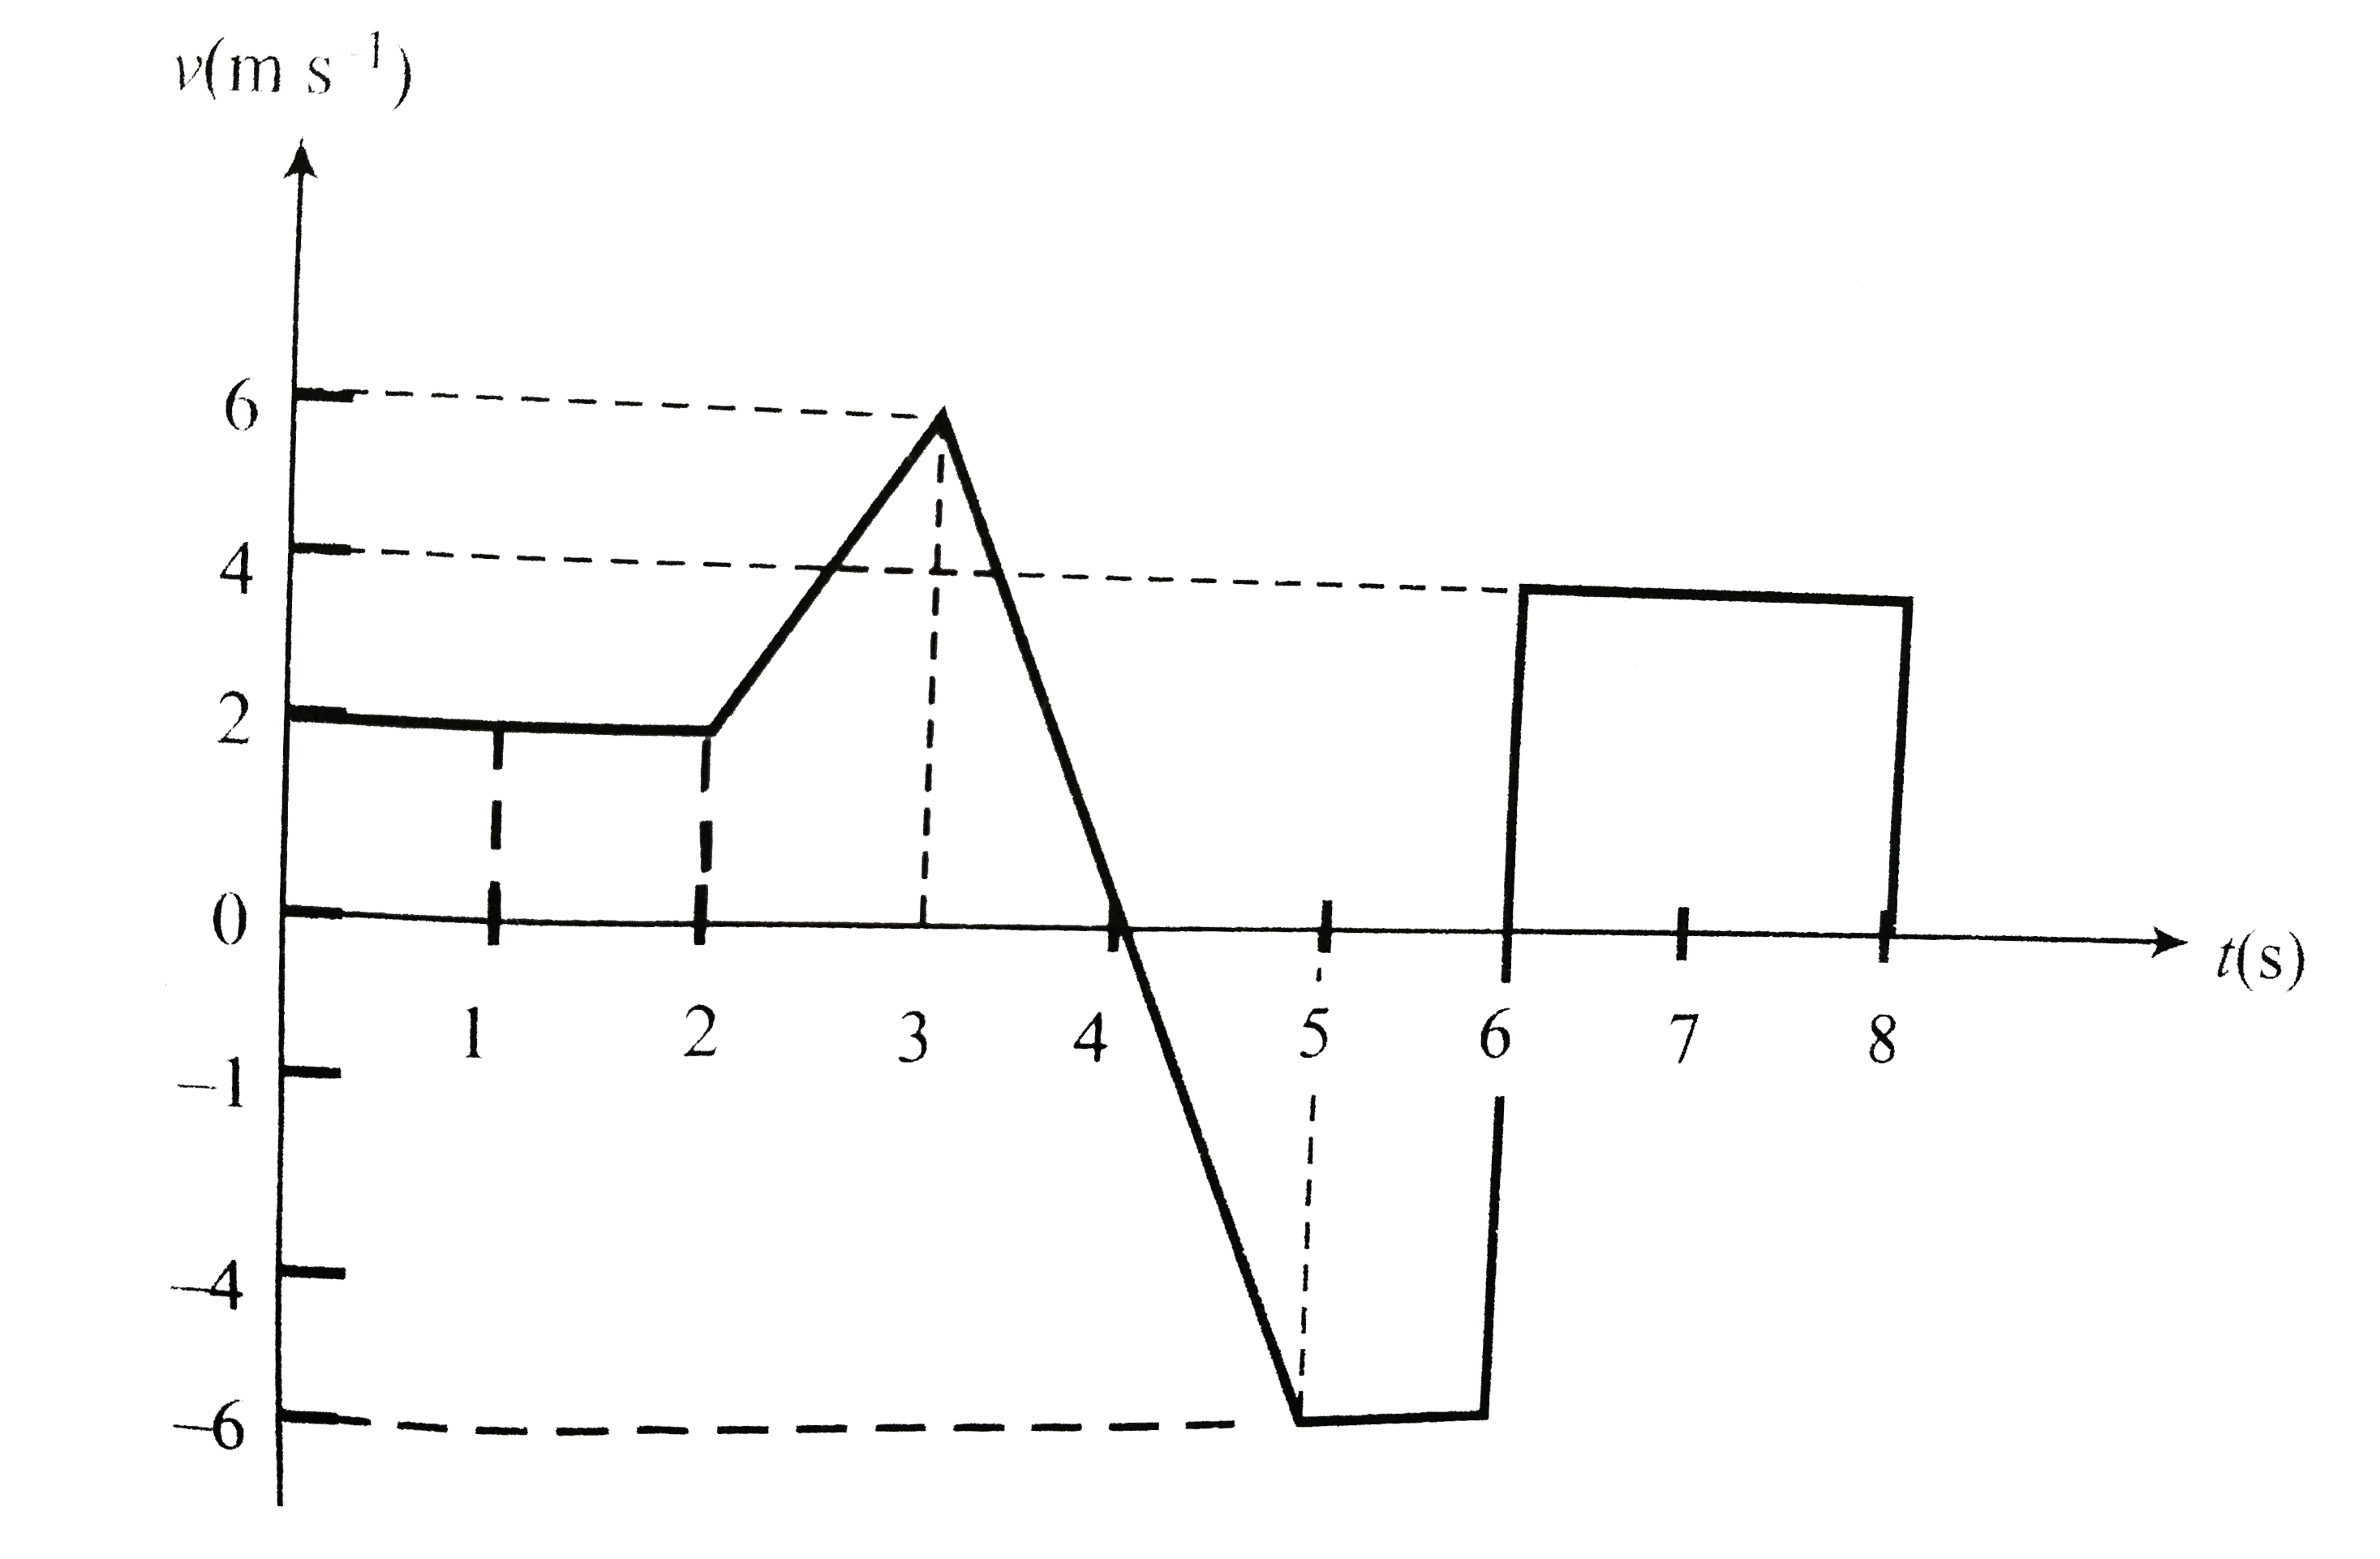
A
B
C
D
Text Solution
Verified by Experts
The correct Answer is:
Topper's Solved these Questions
KINEMATICS-1
CENGAGE PHYSICS ENGLISH|Exercise Graphical cancept|1 VideosKINEMATICS-1
CENGAGE PHYSICS ENGLISH|Exercise Multiple Correct|16 VideosKINEMATICS-1
CENGAGE PHYSICS ENGLISH|Exercise Single Correct|52 VideosGRAVITATION
CENGAGE PHYSICS ENGLISH|Exercise INTEGER_TYPE|1 VideosKINEMATICS-2
CENGAGE PHYSICS ENGLISH|Exercise Exercise Integer|9 Videos
Similar Questions
Explore conceptually related problems
CENGAGE PHYSICS ENGLISH-KINEMATICS-1-Graphical Concept
- The velocity-time graph of a body is shown in . The displacement of ...
Text Solution
|
- The variation of velocity of a particle moving along a straight line i...
Text Solution
|
- The follwing graph shows the variation of velocity of a rocker with ti...
Text Solution
|
- From athe velocity time graph, given in of a particle moving in a stra...
Text Solution
|
- The velovity-time graph of a particle moving in a straitht line is sho...
Text Solution
|
- The velocity-time graph of a body is given in. The maximum acceleratio...
Text Solution
|
- The displacement-time graph of a body is shown in. . The velocity-...
Text Solution
|
- An object thrown vertically. Thevelocity-time graph for the motion of ...
Text Solution
|
- From a high tower, at time t=0, one stone is dropped from rest and sim...
Text Solution
|
- An object is verically thrown upwards. The the dislacement-time graph ...
Text Solution
|
- The graph as shown in. below descrines the motion of a ball rebounding...
Text Solution
|
- The acceleration versus time graph of a particle is shown in. The resp...
Text Solution
|
- The displacement-time graph of a moving particle with constant acceler...
Text Solution
|
- Two balls are dropped from the top of a hight tower with a time interv...
Text Solution
|
- The acceleration versus time graph of a particle moving in a straight ...
Text Solution
|
- The acceleration-time graph of a particle moving along a straight line...
Text Solution
|
- Plot the acceleration-time graph of the welocity-time graph given in. ...
Text Solution
|
 .
.