 .
.A
B
C
D
Text Solution
Verified by Experts
The correct Answer is:
 .
. 


Topper's Solved these Questions
KINEMATICS-1
CENGAGE PHYSICS ENGLISH|Exercise Assertion-reasoning|5 VideosKINEMATICS-1
CENGAGE PHYSICS ENGLISH|Exercise Linked Comprehension|30 VideosKINEMATICS-1
CENGAGE PHYSICS ENGLISH|Exercise Graphical cancept|1 VideosGRAVITATION
CENGAGE PHYSICS ENGLISH|Exercise INTEGER_TYPE|1 VideosKINEMATICS-2
CENGAGE PHYSICS ENGLISH|Exercise Exercise Integer|9 Videos
Similar Questions
Explore conceptually related problems
CENGAGE PHYSICS ENGLISH-KINEMATICS-1-Multiple Correct
- Cleck up the onlycorrect statements in the following :
Text Solution
|
- A block slides down a smooth inclined placne when released from the to...
Text Solution
|
- A car accelerates from rest at a constant rate of 2 m s^(-2) for some ...
Text Solution
|
- At t=0, an arrow is fired vertically upwards with a speed of 100 m s^(...
Text Solution
|
- Two bodies of masses (m(1)) and (m(2)) are droppded from heithts h(1) ...
Text Solution
|
- From the top of a tower of height 200 m, a ball A is projected up with...
Text Solution
|
- A body starts from rest and then moves with uniform acceleration. Then...
Text Solution
|
- Which of the following statements is//are correct ?
Text Solution
|
- The body will speed up if .
Text Solution
|
- Average acceleration is in the direction of .
Text Solution
|
- A particle is projected vertically upward with velocity u from a point...
Text Solution
|
- A particle moves along a straight line its velocity dipends on time as...
Text Solution
|
- The velocity time plot for a particle moving on straight line is show...
Text Solution
|
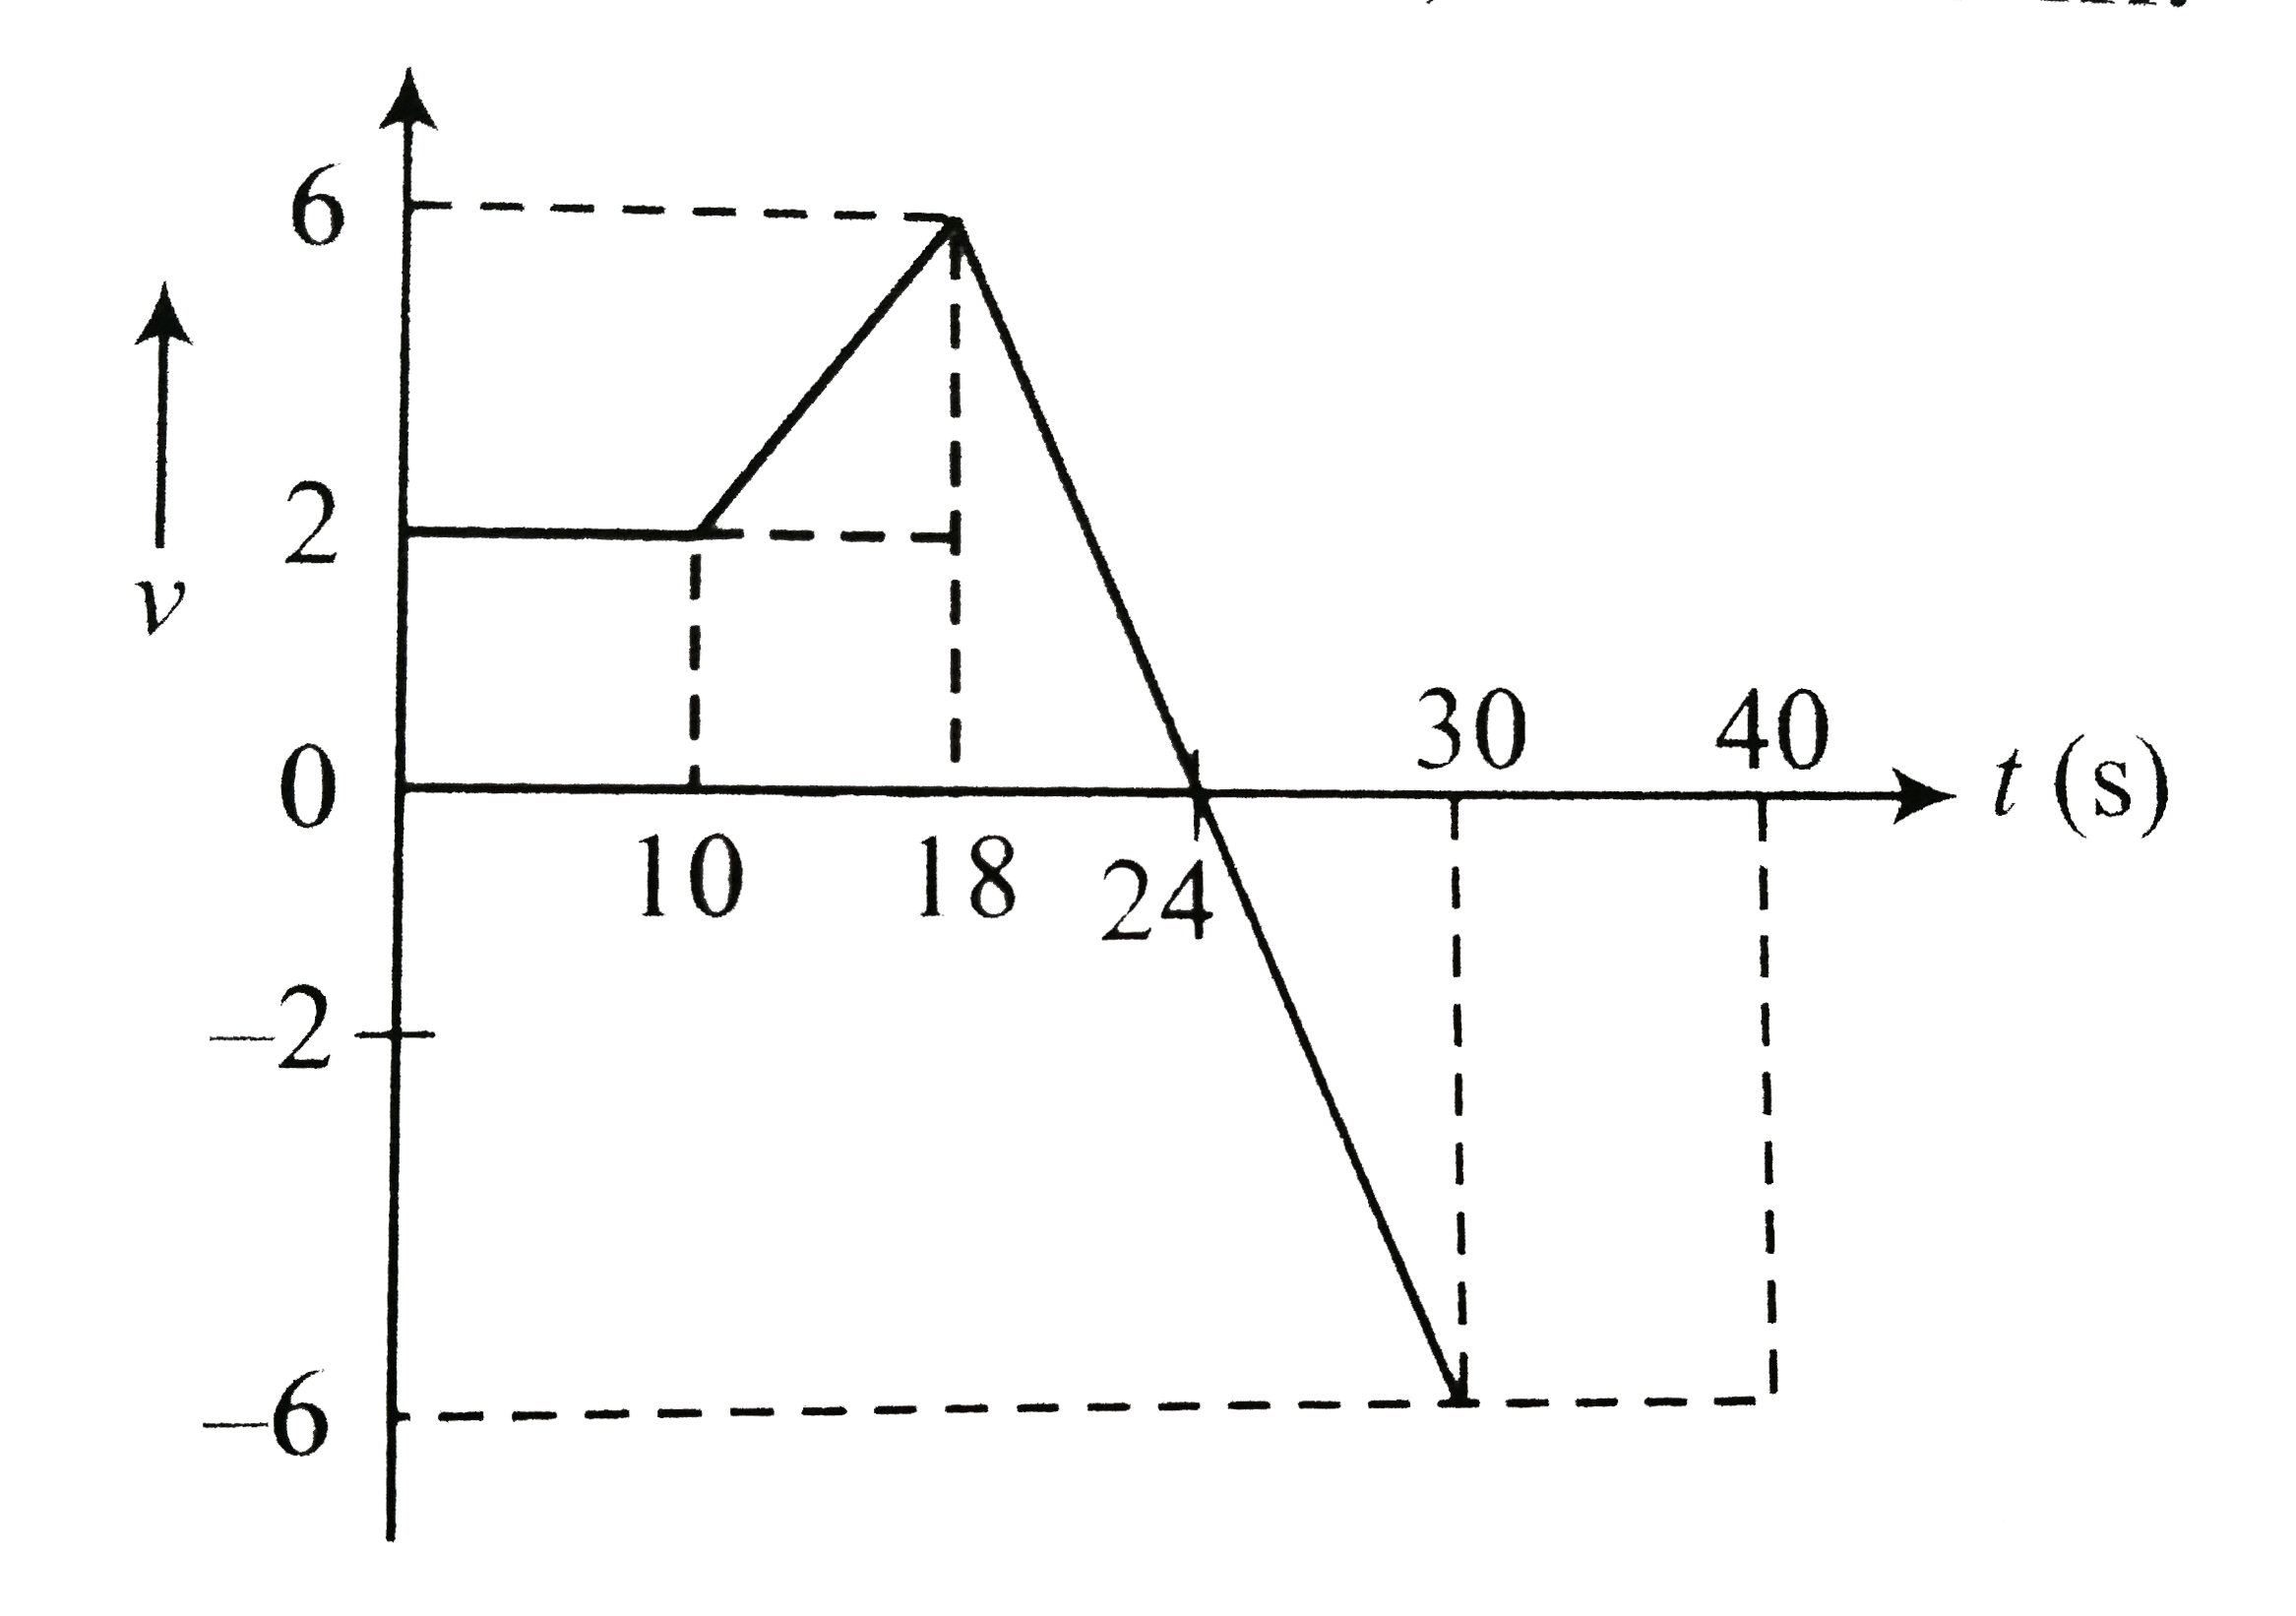
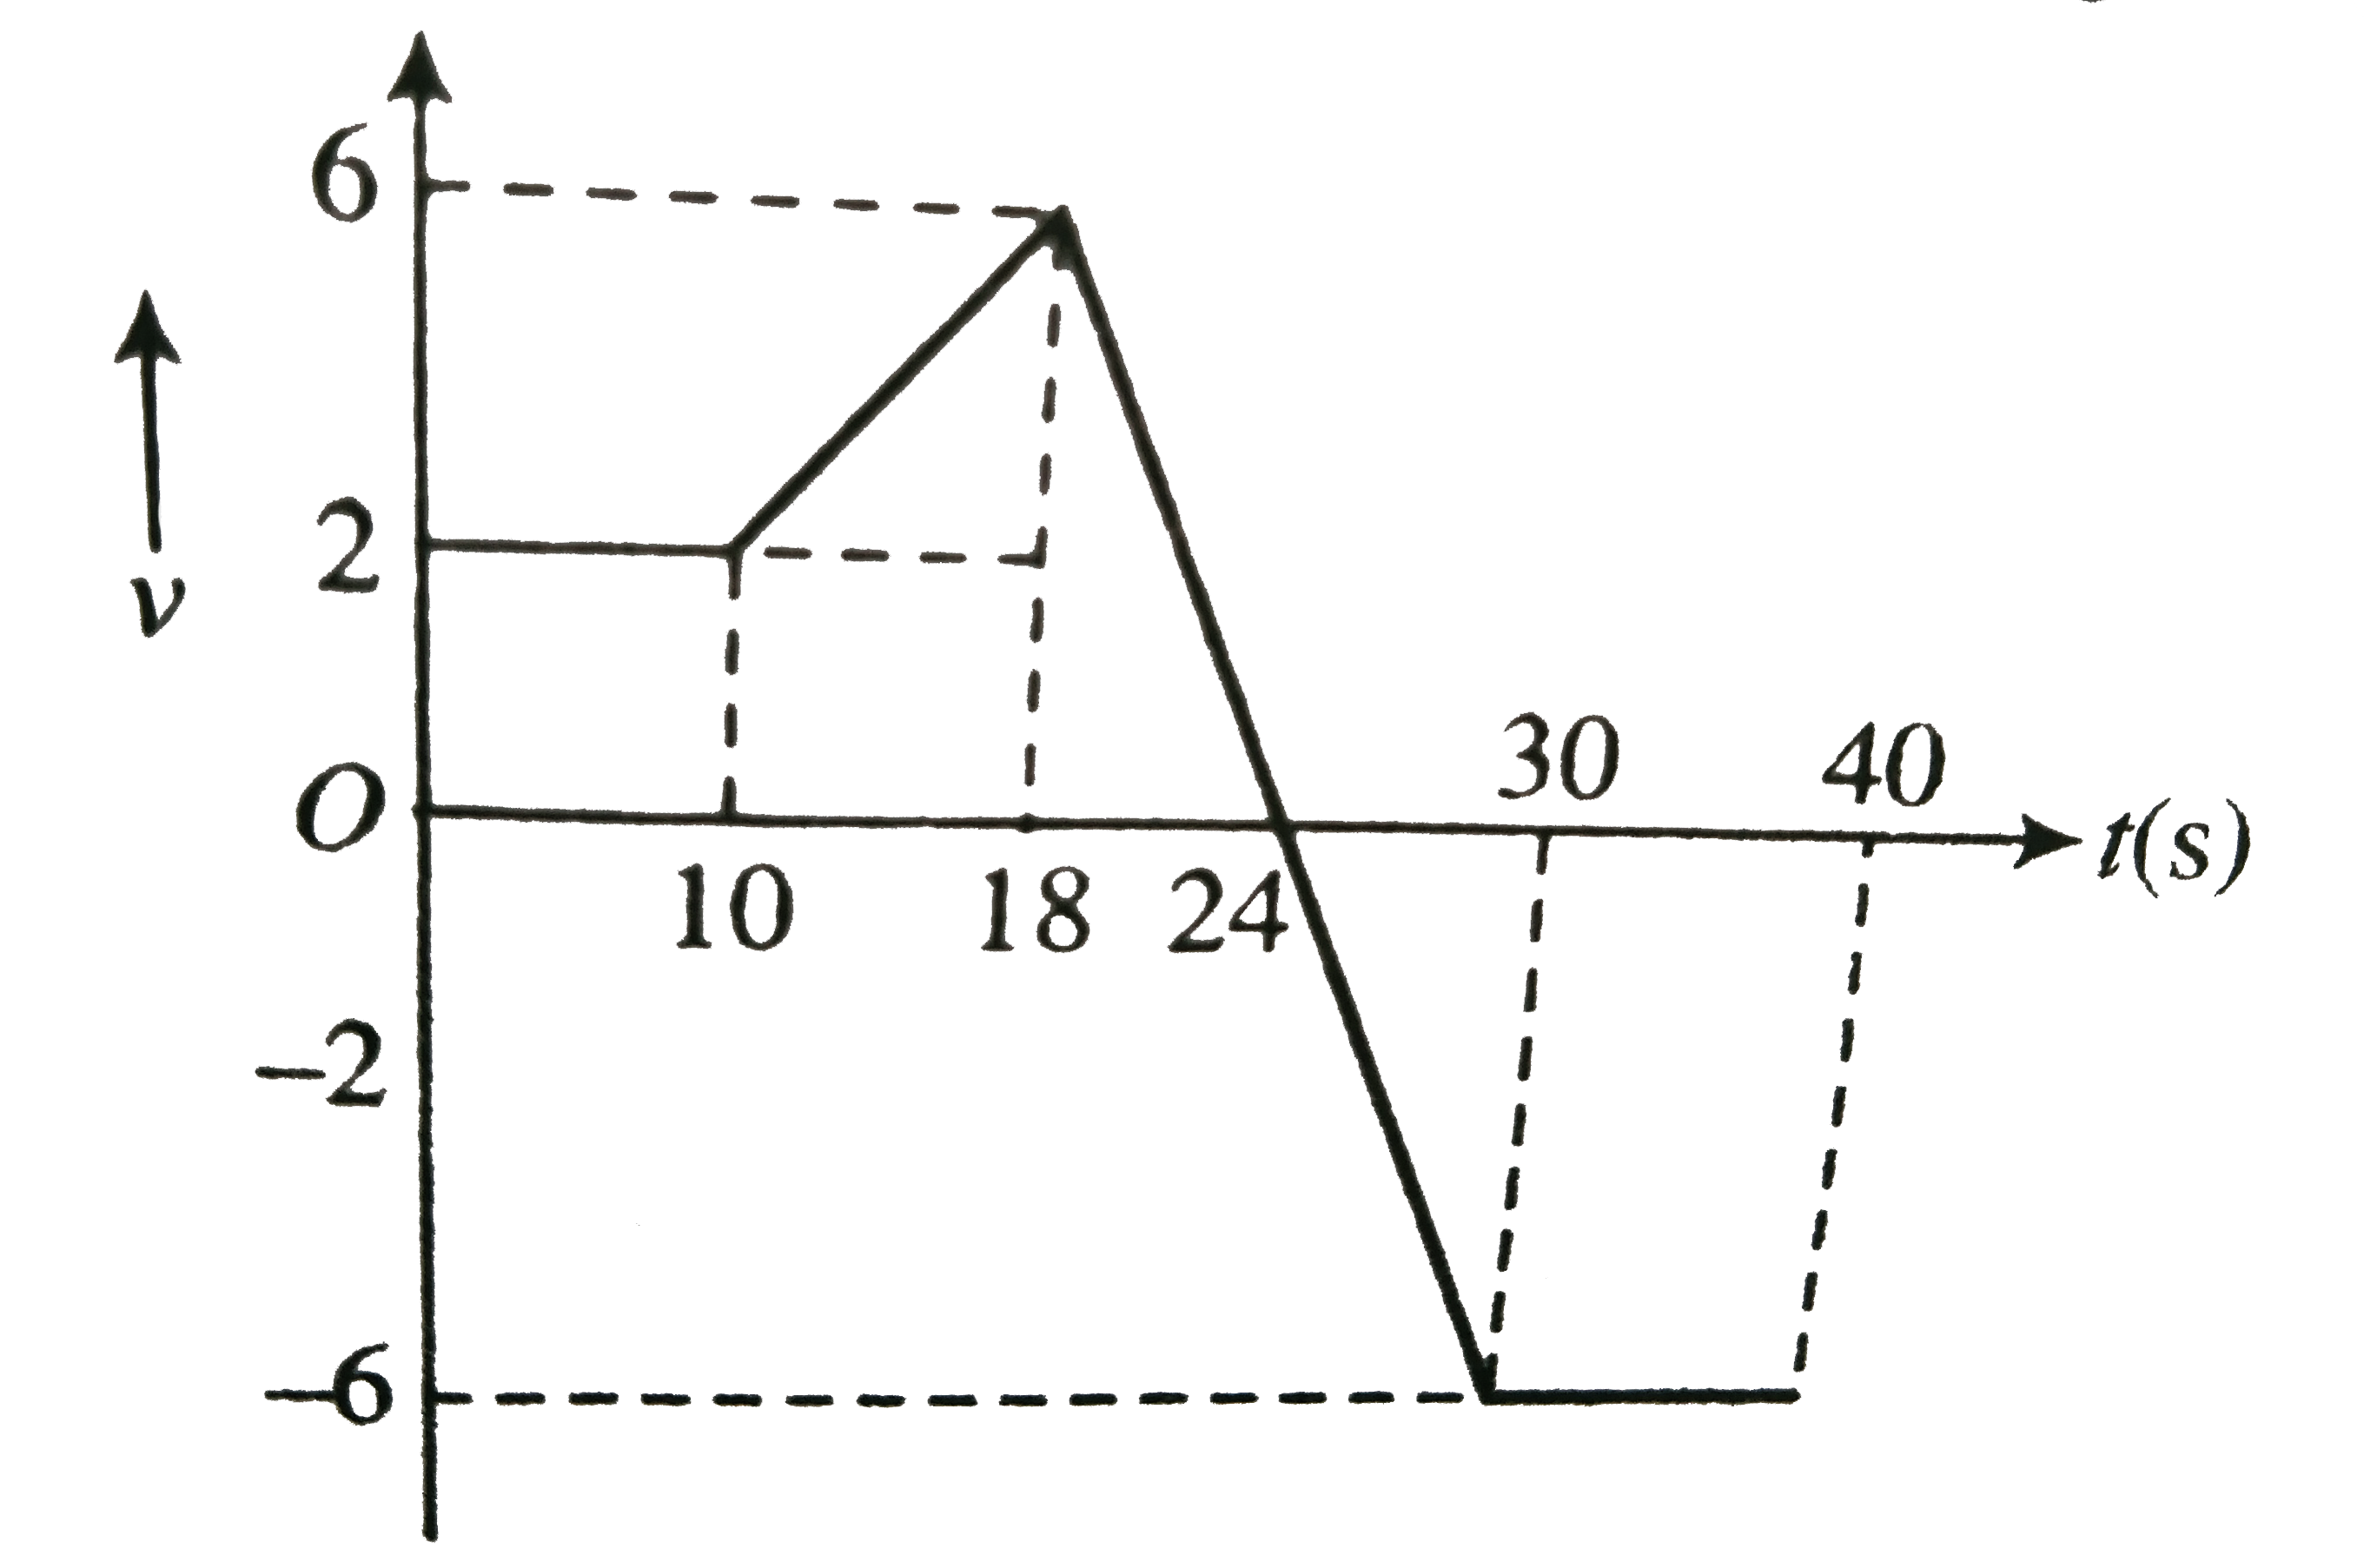
- The figure shows the velocity (v) of a particle plotted against time (...
Text Solution
|
- The displacement of a particle as a function of time is shown in . It ...
Text Solution
|
- A particle moves in a straight line with the velcity as shown in. At t...
Text Solution
|