Text Solution
Verified by Experts
The correct Answer is:


Topper's Solved these Questions
MOTION IN STRAIGHT LINE
AAKASH INSTITUTE ENGLISH|Exercise Assignment (SECTION - H)|9 VideosMOTION IN STRAIGHT LINE
AAKASH INSTITUTE ENGLISH|Exercise Assignment (SECTION - I)|3 VideosMOTION IN STRAIGHT LINE
AAKASH INSTITUTE ENGLISH|Exercise Assignment (SECTION - F)|2 VideosMOTION IN A STRAIGHT LINE
AAKASH INSTITUTE ENGLISH|Exercise ASSIGNMENT (SECTION - D)|15 VideosMOVING CHARGE AND MAGNESIUM
AAKASH INSTITUTE ENGLISH|Exercise SECTION D|16 Videos
Similar Questions
Explore conceptually related problems
AAKASH INSTITUTE ENGLISH-MOTION IN STRAIGHT LINE-Assignment (SECTION - G)
- The velocity of a particle moving on the x-axis is given by v=x^(2)+x,...
Text Solution
|
- Does the escape speed of a body from the earth depend on. (i)mass of...
Text Solution
|
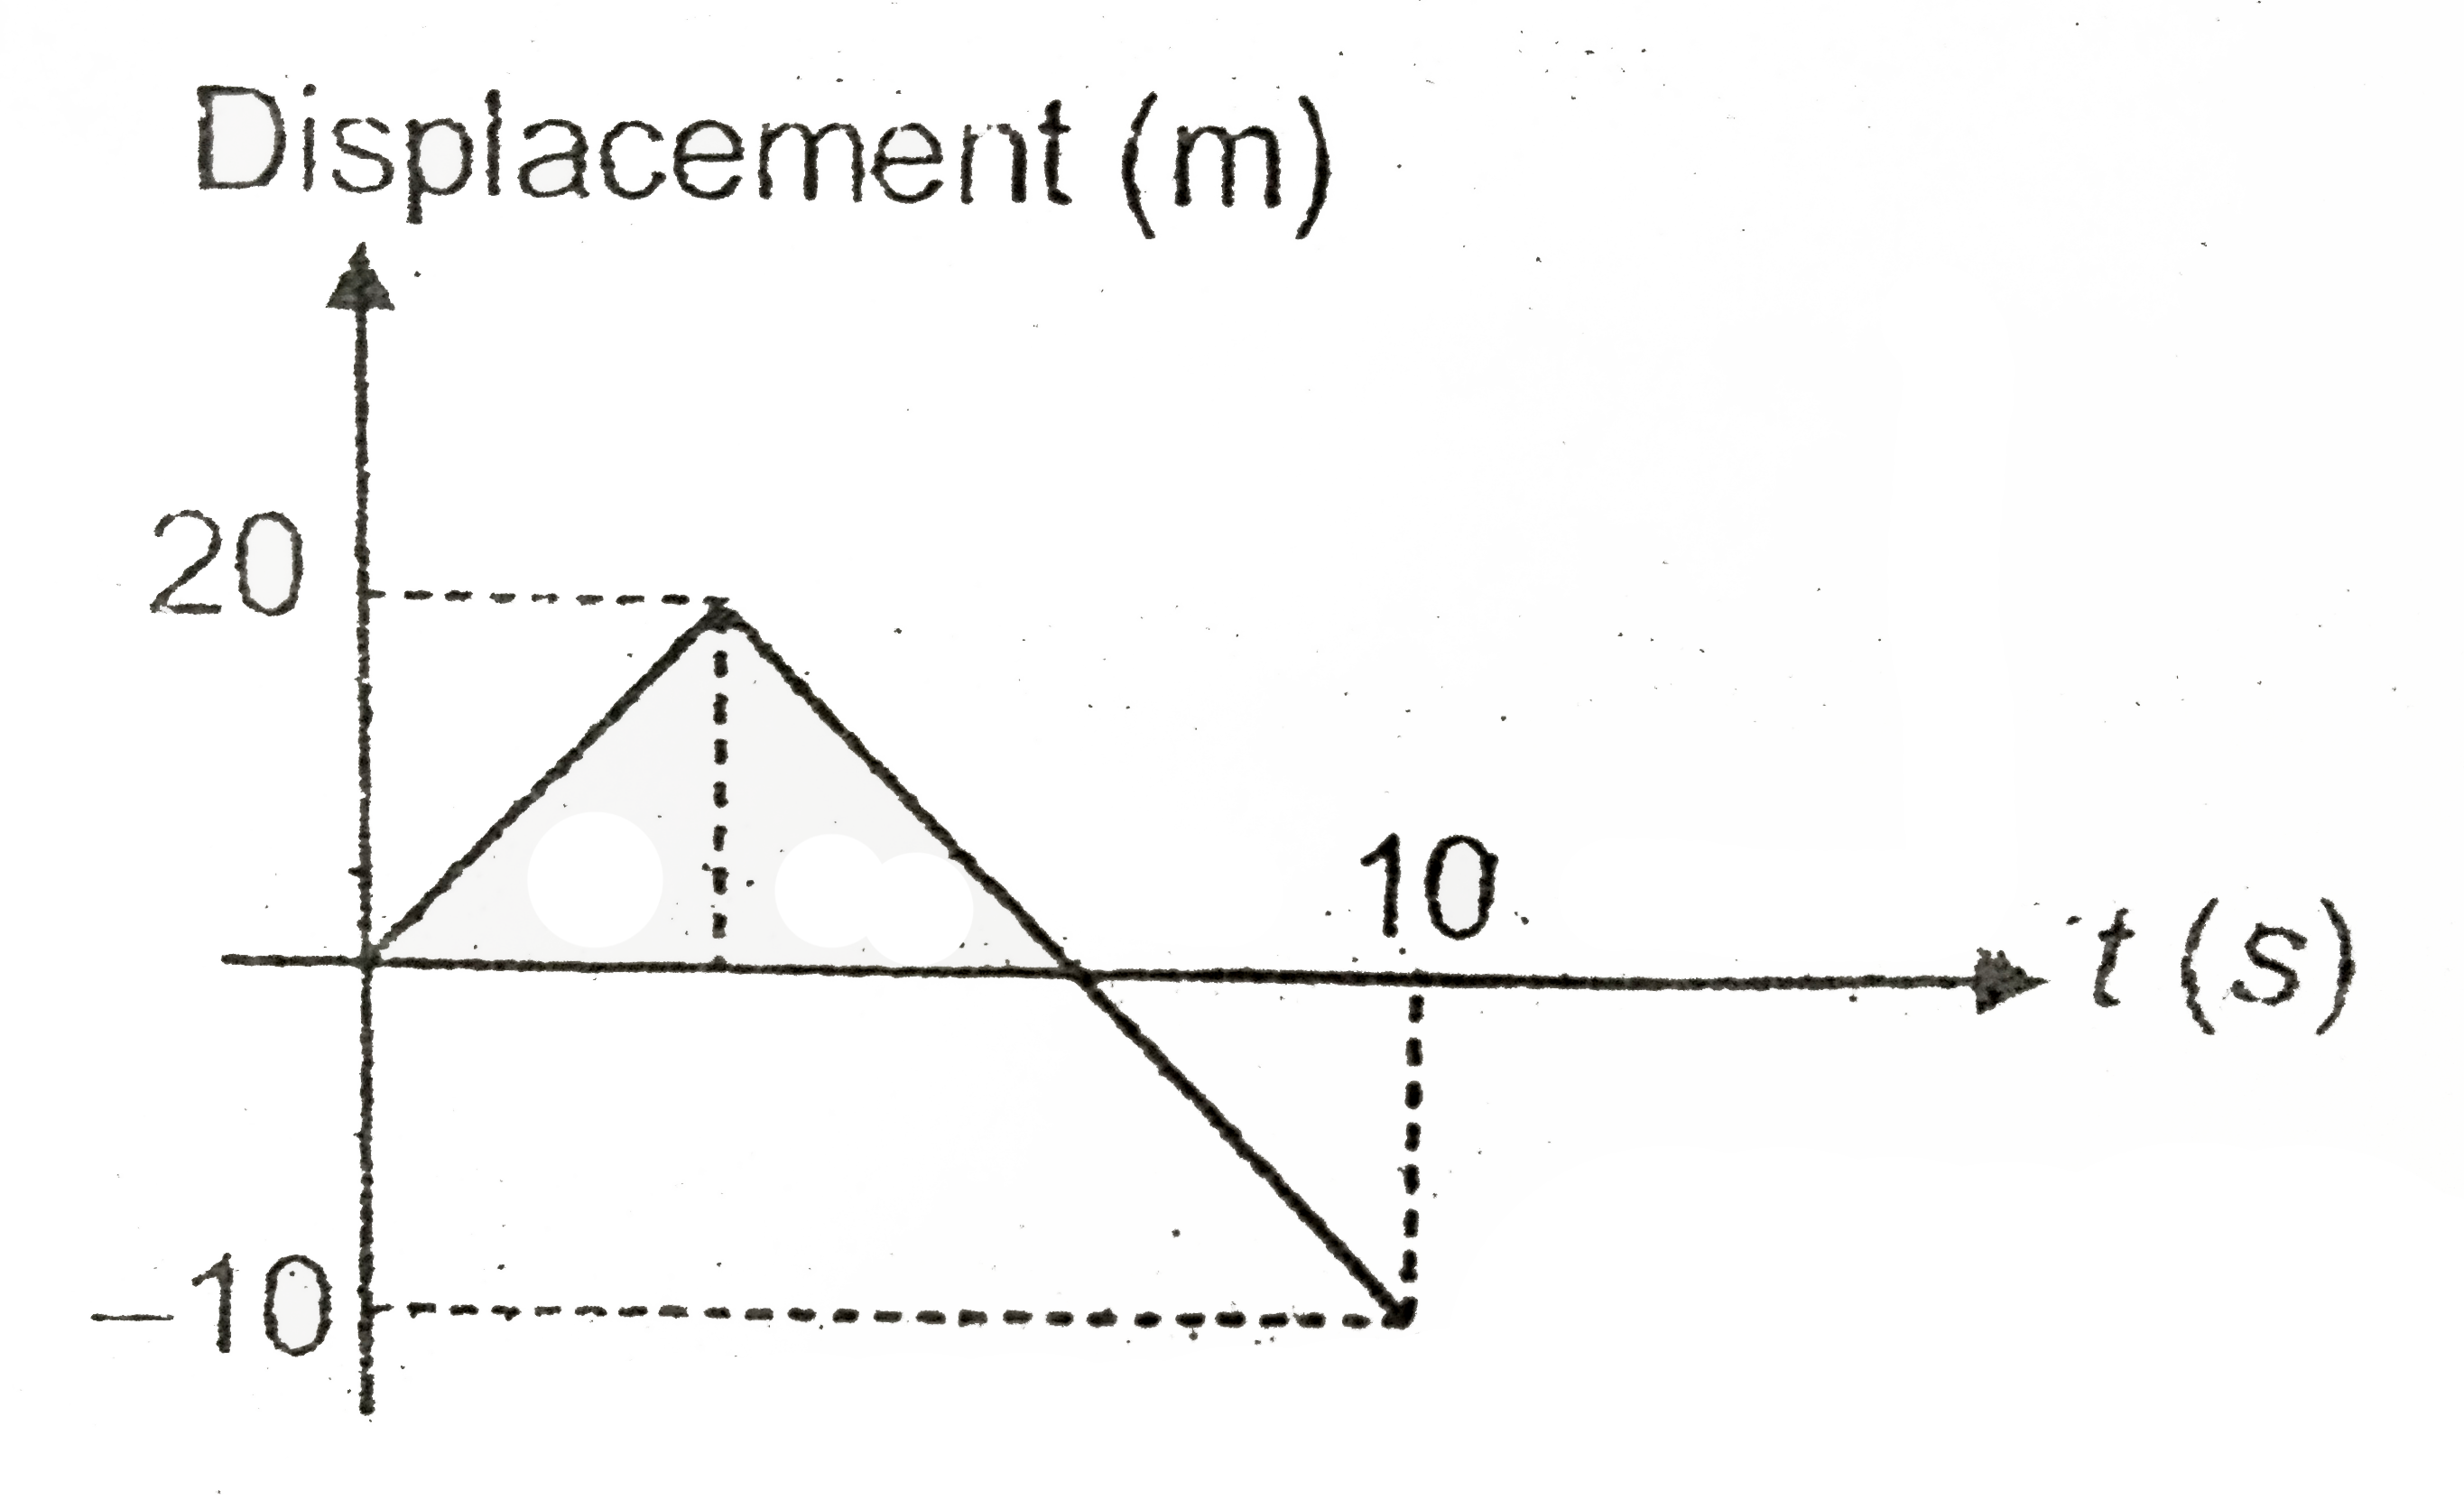
- The diagram shows the displacement-time graph for the particle moving ...
Text Solution
|
- A boy standing on the top of a tower of height 54 ft. throws a packet ...
Text Solution
|