Text Solution
Verified by Experts


Topper's Solved these Questions
Similar Questions
Explore conceptually related problems
VMC MODULES ENGLISH-KINEMATICS OF A PARTICLE -JEE Advanced (archive)
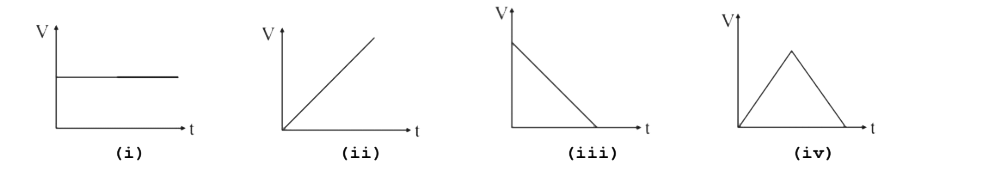
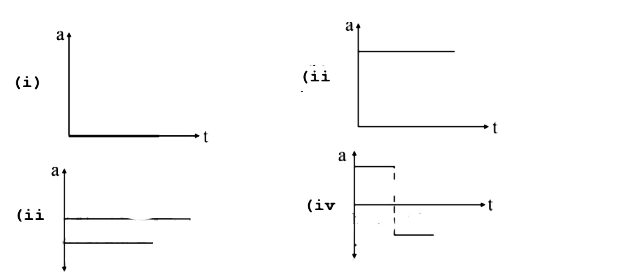
- Draw the acceleration-time graphs for the given velocity-time graphs o...
Text Solution
|
- A ship of mass 3 xx 10^(7)kg initaily at rest , is pulley by a force o...
Text Solution
|
- A particles is moving eastwards with a velocity of 5 ms^(-1). In 10 s,...
Text Solution
|
- A particle moving in a straight line covers half the distance with a s...
Text Solution
|
- A particle initially (i.e., at t = 0) moving with a velocity u is subj...
Text Solution
|
- In 1.0 s, a particles goes from point A to point B, moving in a semici...
Text Solution
|
- A ball is dropped vertically from a height d above the ground. It hits...
Text Solution
|
- A particles starts sliding down a frictionless inclined plane. If Sn i...
Text Solution
|
- A particles starts from rest. Its acceleration (a) versus time (t) is ...
Text Solution
|
- The displacement x of a particle varies with time according to the rel...
Text Solution
|
- A particle of mass m moves on the x- axis as follows : it starts from...
Text Solution
|
- A rocket is moving in a gravity free space with a constant acceleratio...
Text Solution
|
- A particle moves in a circle of radius R. In half the period of revolu...
Text Solution
|
- Four persons K,L,M,N are initially at the four corners of a square of ...
Text Solution
|
- Two balls of different masses are thrown vertically upwards with the s...
Text Solution
|