A
B
C
D
Text Solution
Verified by Experts
The correct Answer is:


Topper's Solved these Questions
Similar Questions
Explore conceptually related problems
S CHAND IIT JEE FOUNDATION-LINEAR INEQUALITIES-SELF ASSESMENT SHEET -13
- The greatest value of x that satisfies the inequality 2x+3lt25, where ...
Text Solution
|
- Which graph represents the solution of the inequality x subtracted fro...
Text Solution
|
- You are buying a carpet for a rectangular room. The carpet canbe at mo...
Text Solution
|
- The absolute value of a number is its distance from 0 on a number line...
Text Solution
|
- The graph of which inequality is shown below:
Text Solution
|
- The solution set of xge5, yge0 and xle5,yle0 is
Text Solution
|
- Given agt0,bgt0,agtb and c!=0. Which in-equality is not always correct...
Text Solution
|
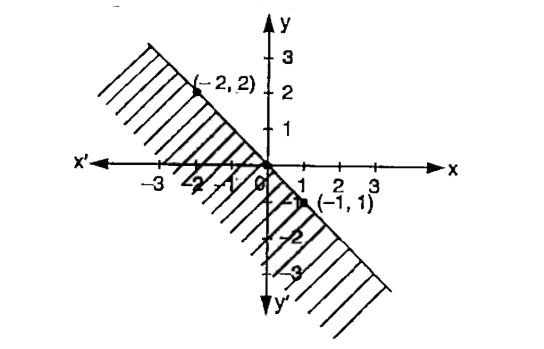
- The shaded region is represented by the inequality:
Text Solution
|
- Solve |1-x|gt3.
Text Solution
|
- If x an integer greater than -10, but less than 10 and |x-2|lt3, then ...
Text Solution
|