Text Solution
Verified by Experts
The correct Answer is:


Topper's Solved these Questions
DATA HANDLING
MTG IIT JEE FOUNDATION|Exercise NCERT Section (Exercise - 3 .4 ) |8 VideosDATA HANDLING
MTG IIT JEE FOUNDATION|Exercise Exercise (Level - 1) M.C.Q |35 VideosDATA HANDLING
MTG IIT JEE FOUNDATION|Exercise NCERT Section (Exercise - 3 .2 ) |9 VideosCONGRUENCE OF TRIANGLES
MTG IIT JEE FOUNDATION|Exercise Olympiad/HOTS Corner|10 VideosEXPONENTS AND POWERS
MTG IIT JEE FOUNDATION|Exercise OLYMPIAD/HOTS CORNER|15 Videos
Similar Questions
Explore conceptually related problems
MTG IIT JEE FOUNDATION-DATA HANDLING-NCERT Section (Exercise - 3 .3 )
- Use the bar graph to answer the following questions Which is the ...
Text Solution
|
- Use the bar graph to answer the following questions How many stude...
Text Solution
|
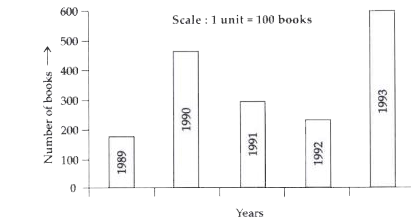
- Read the bar graph which shows the number of books sold by a bookstor...
Text Solution
|
- Read the bar graph which shows the number of books sold by a bookstor...
Text Solution
|
- Read the bar graph which shows the number of books sold by a bookstor...
Text Solution
|
- Read the bar graph which shows the number of books sold by a bookstor...
Text Solution
|
- Number of children in six different classes are given below. ...
Text Solution
|
- Answer the following questions Which class has the maximum number ...
Text Solution
|
- Answer the following questions Find the ratio of students of class ...
Text Solution
|
- The performance of a student in 1^(st) Term and 2^(nd) Term is given....
Text Solution
|
- The performance of a student in 1^(st) Term and 2^(nd) Term is given....
Text Solution
|
- The performance of a student in 1^(st) Term and 2^(nd) Term is given....
Text Solution
|
- Consider this data collected from a survey of a colony Draw a do...
Text Solution
|
- Consider this data collected from a survey of a colony Which sp...
Text Solution
|
- Consider this data collected from a survey of a colony Which is...
Text Solution
|
- Take the data giving the minimum and the maximum temperature of variou...
Text Solution
|
- Take the data giving the minimum and the maximum temperature of variou...
Text Solution
|
- Take the data giving the minimum and the maximum temperature of variou...
Text Solution
|
- Take the data giving the minimum and the maximum temperature of variou...
Text Solution
|