A
B
C
D
Text Solution
Verified by Experts


Topper's Solved these Questions
DATA HANDLING
MTG IIT JEE FOUNDATION|Exercise Exercise (Level - 2) M.C.Q |15 VideosDATA HANDLING
MTG IIT JEE FOUNDATION|Exercise Exercise (Level - 2) Match the Following |2 VideosDATA HANDLING
MTG IIT JEE FOUNDATION|Exercise NCERT Section (Exercise - 3 .4 ) |8 VideosCONGRUENCE OF TRIANGLES
MTG IIT JEE FOUNDATION|Exercise Olympiad/HOTS Corner|10 VideosEXPONENTS AND POWERS
MTG IIT JEE FOUNDATION|Exercise OLYMPIAD/HOTS CORNER|15 Videos
Similar Questions
Explore conceptually related problems
MTG IIT JEE FOUNDATION-DATA HANDLING-Exercise (Level - 1) M.C.Q
- A latter is chosen at random from the word 'MATHEMATICS' .The probabil...
Text Solution
|
- A box contains 50 coloured balls, What is the total number of white ba...
Text Solution
|
- Garima, spins a spinner that is split into 8 equal sections. The s...
Text Solution
|
- This frequency table shows the results of a small class quiz . If a st...
Text Solution
|
- The king, queen and jack of hearts are removed from a deck of 52 playi...
Text Solution
|
- What is the probability of getting a black king from a pack of 52 ca...
Text Solution
|
- The data given below shows the time (in minutes) taken by nine student...
Text Solution
|
- Soni has digit cards 1, 4 and 7 . She makes 2 - digit numbers using...
Text Solution
|
- Twelve sided dice is used in adventure games . They are marked with ...
Text Solution
|
- A card is drawn from a pack of 52 cards. What is the probability that...
Text Solution
|
- The mean of the first ten natural numbers is
Text Solution
|
- The probability of getting a number less than or equal to 6 when a ...
Text Solution
|
- The mean of 5 observations is 14. If one of the observations is wrong...
Text Solution
|
- The heights of a group of people (in cm) are 121, 118, 115, 130, 100,...
Text Solution
|
- The mean of 12, 10, x, 20 and 18, is 17. Find x
Text Solution
|
- The mean of 5 observations is 3 and if one more observation is added...
Text Solution
|
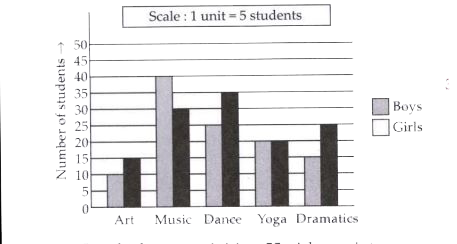
- The bar graph given below shows the interest of boys and girls in dif...
Text Solution
|
- The bar graph given below shows the interest of boys and girls in dif...
Text Solution
|
- For what value of x the mode of the following data is 15 ? 15, 16, 17,...
Text Solution
|
- A coin is tossed 20 times. The number of times head occurred and tail...
Text Solution
|