A
B
C
D
Text Solution
Verified by Experts


Topper's Solved these Questions
DATA HANDLING
MTG IIT JEE FOUNDATION|Exercise Exercise (Level - 2) Match the Following |2 VideosDATA HANDLING
MTG IIT JEE FOUNDATION|Exercise Exercise (Level - 2) Assertion & Reason Type |5 VideosDATA HANDLING
MTG IIT JEE FOUNDATION|Exercise Exercise (Level - 1) M.C.Q |35 VideosCONGRUENCE OF TRIANGLES
MTG IIT JEE FOUNDATION|Exercise Olympiad/HOTS Corner|10 VideosEXPONENTS AND POWERS
MTG IIT JEE FOUNDATION|Exercise OLYMPIAD/HOTS CORNER|15 Videos
Similar Questions
Explore conceptually related problems
MTG IIT JEE FOUNDATION-DATA HANDLING-Exercise (Level - 2) M.C.Q
- A person made 165 telephone calls in the month of May in a year . It w...
Text Solution
|
- In the data given below, the observation p is missing 2 . 5 , 1 . 5...
Text Solution
|
- A batsman scores 80 runs in his sixth innings and thus increases his...
Text Solution
|
- You spin the spinner at right, which is divided into equal parts. Whi...
Text Solution
|
- The probability that Vikram is late for school in the morning is 0 . ...
Text Solution
|
- Khilona earned scores of 97, 73 and 88 respectively in her first three...
Text Solution
|
- The mean of 11 numbers is 7 . If each number is multiplied by 6 , then...
Text Solution
|
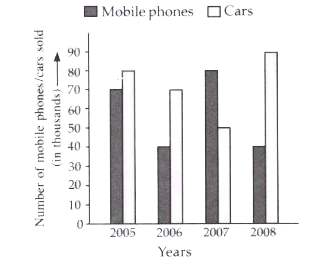
- The given double bar graph shows the sale of mobile phone and cars f...
Text Solution
|
- What is the probability of drawing a card numbered six from a deck of ...
Text Solution
|
- Which of the following is true ?
Text Solution
|
- Average of the marks in maths of 40 students in a class was 74 . The ...
Text Solution
|
- One of 26 letter keys on a type writer is pressed. What is the proba...
Text Solution
|
- Find the mean of integers lying between - 5 and 5
Text Solution
|
- In a bag, there are seven cards numbered 1 to 7 . A card is picked at...
Text Solution
|
- The average of five numbers is 35 . If sum of three of these number...
Text Solution
|