Home
Class 7
MATHS
the given bar graph shows the number...

the given bar graph shows the numbers of puspils who participated in the fitness test in different days of the week .

what percentage of the total number of puipil had their test on Wednesday ?

A

`30%`

B

`25%`

C

`22.5%`

D

`27.5%`

Text Solution

Verified by Experts

Promotional Banner

Topper's Solved these Questions

  • DATA HANDLING

    MTG IIT JEE FOUNDATION|Exercise Exercise (Level - 2) Subjective Problems |10 Videos
  • CONGRUENCE OF TRIANGLES

    MTG IIT JEE FOUNDATION|Exercise Olympiad/HOTS Corner|10 Videos
  • EXPONENTS AND POWERS

    MTG IIT JEE FOUNDATION|Exercise OLYMPIAD/HOTS CORNER|15 Videos

Similar Questions

Explore conceptually related problems

The given bar graph, shows the number of students in different classes. Find the total number of students in the classes VIII to X.

Answer the questions based on the information given below: The given cascade bar graph provides the information about the number of girls and boys participated in a dance competition of NH Goel school on five different days of a week and the table give the details about the percentage of students participated on different days who lost the competition. Total number of students participated in a day = Number of girls participated in a day + Number of boys participated in a day Total number of students participated = Total number of students who lost the competition participated + Total number of students who won the competition participated Find the ratio of the number of students who lost the competition on Tuesday to the number of students who won the competition on Wednesday.

Answer the questions based on the information given below: The given cascade bar graph provides the information about the number of girls and boys participated in a dance competition of NH Goel school on five different days of a week and the table give the details about the percentage of students participated on different days who lost the competition. Total number of students participated in a day = Number of girls participated in a day + Number of boys participated in a day Total number of students participated = Total number of students who lost the competition participated + Total number of students who won the competition participated Find the ratio between the number of students who won on Wednesday to the number of students who won on Thursday

Answer the questions based on the information given below: The given cascade bar graph provides the information about the number of girls and boys participated in a dance competition of NH Goel school on five different days of a week and the table give the details about the percentage of students participated on different days who lost the competition. Total number of students participated in a day = Number of girls participated in a day + Number of boys participated in a day Total number of students participated = Total number of students who lost the competition participated + Total number of students who won the competition participated If the ratio of number of girls lost to the number of boys lost on Thursday is 7: 5 respectively, then the number of girls lost on Thursday was what percentage of the number of boys participated on Monday?

The bar chart given below shows the number of audience in a multiscreen theatre for three shows . What is the percentage increase in the total number of audience second show to third show ?

The given bar graph, shows the number of students in different classes. Arrange the classes in descending order of student population.

The given bar graph represents the number of students who appeared in the board examination in session 2017-18 and 2018-19. Study the graph and answer the question that follows. What percentage is the total number of students who appeared in 2017-18 is less than the total number of students who appeared in 2018-19?

The given bar graph shows the number of students of two schools over a period of six years. In the bar graph, what is the ratio of the average of the total students from school A to the average of the total students from school B ?

The given bar graph shows the marks obtained by students in a Science test. Who scored the highest marks in the test ? Whats in the score ?

The bar graph shows the number of toys produced by a factory during a certain week. What is the total number of toys produced during the week ?

MTG IIT JEE FOUNDATION-DATA HANDLING-Olympiad / Hots Corner
  1. The mean of three numbers is 40. All the three numbers are different n...

    Text Solution

    |

  2. The given bar graph shows heights of lakes. Find the difference in el...

    Text Solution

    |

  3. The number of toffees in 30 gift packs are given as follows : 5, 6,...

    Text Solution

    |

  4. The letters written on paper slips of the word MATHEMATICS are put ...

    Text Solution

    |

  5. The bar graph below shows the number of cars passed through a toll tax...

    Text Solution

    |

  6. The bar graph below shows the number of cars passed through a toll tax...

    Text Solution

    |

  7. Observe the given data of the height of 15 studetns (in cm 146, 139,...

    Text Solution

    |

  8. Out of 5 brands of chocolates in a shop, a boy has to purchase the bra...

    Text Solution

    |

  9. The runs scored in a cricket match by 11 players are as follows : 9,...

    Text Solution

    |

  10. The mean, median, unique mode and range of a collection of eight integ...

    Text Solution

    |

  11. The following are the margins of victory in the matches of a football...

    Text Solution

    |

  12. The given double bar graph show the buyers DVDs and CDs. Study the gra...

    Text Solution

    |

  13. The given double bar graph show the buyers DVDs and CDs. Study the gra...

    Text Solution

    |

  14. Which of the following statements is incorrect ?

    Text Solution

    |

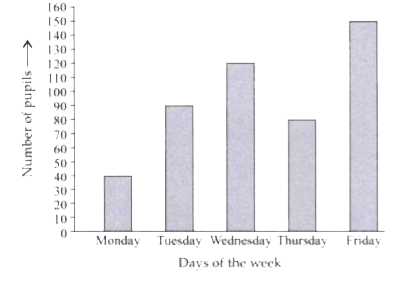
  15. the given bar graph shows the numbers of puspils who participate...

    Text Solution

    |

  16. A bag contains 5 blue gems, 8 red gems and 2 green gems. A gem is dr...

    Text Solution

    |

  17. The grades obtained by 30 students of class VII are as follows : A^(+)...

    Text Solution

    |

  18. Find the sum of the mode and the median of the given data 2, 4, 3, ...

    Text Solution

    |

  19. In a class, there are 20 girls and 30 boys . The mean weight of 20 gir...

    Text Solution

    |

  20. A survey of the local neighbourhood showed that age of 25% of the po...

    Text Solution

    |