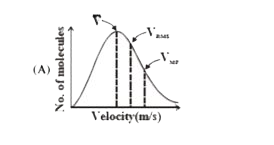
A
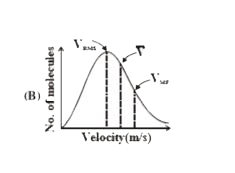
B
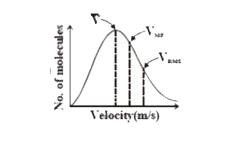
C
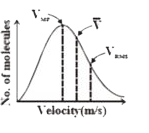
D
Text Solution
Verified by Experts
The correct Answer is:


Topper's Solved these Questions
Similar Questions
Explore conceptually related problems
KVPY PREVIOUS YEAR-QUESTION PAPER 2020-PART-II(CHEMISTRY)
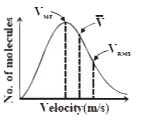
- Among the following , the plot that shows the correct marking of most ...
Text Solution
|
- An organic compound X with molecular formula C(11)H(14) gives an optic...
Text Solution
|
- The following transformation can be carried out in three sptes. T...
Text Solution
|
- In the following reaction X and Y respectively are :
Text Solution
|
- A two- dimensional solid is made by alternating circles with radius a ...
Text Solution
|
- Consider a reaction that is first order in both direction A overset(...
Text Solution
|
- The reaction CaCO3 hArr CaO(s) + CO2(g) is in equilibrium in a clo...
Text Solution
|
- A container is divided into two compartments by a removable partition ...
Text Solution
|
- Number of stereoisomers possible for the octahedral complex [Co...
Text Solution
|
- When a mixture of NaCl, K2Cr2O7 and conc. H2SO4 is heated in a dry tes...
Text Solution
|
- Sodium borohydride upon treatment with iodine produces a Lewis acid (X...
Text Solution
|