Home
Class 12
PHYSICS
Pressure versus temperature graphs of an...

Pressure versus temperature graphs of an ideal gas are as shown in figure. Choose the wrong statement.

A

Density of gas is incresing in graph (i)

B

Density of gas decreasing in graph (ii)

C

Density of gas isconstant in graph (iii)

D

None of the above

Text Solution

Verified by Experts

The correct Answer is:
D

For equation : `(because p = (rhoRT)/(M_(w)))`
At constant temperature ` rho prop P`
`1`st graph : `rho prop P` At constant temperature
For `2`nd graph : (`because P = (rhoRT)/(M_(w)))`
At constant `P` , `rho prop (1)/(t)`
For `3`rd graph `L: (dP)/(dT)` = constant ` implies P prop T`
`implies ` density `rho` = constant
Promotional Banner

Topper's Solved these Questions

  • GEOMETRICAL OPTICS

    ALLEN|Exercise EXERCISE -02|82 Videos
  • GEOMETRICAL OPTICS

    ALLEN|Exercise EXERCISE -03|10 Videos
  • GEOMETRICAL OPTICS

    ALLEN|Exercise SOME WORKED OUT EXAMPLES|83 Videos
  • CURRENT ELECTRICITY

    ALLEN|Exercise EX.II|66 Videos
  • GRAVITATION

    ALLEN|Exercise EXERCISE 4|9 Videos

Similar Questions

Explore conceptually related problems

Pressure versus temperature graph of an ideal gas is shown in figure. Density of the gas at point A is rho_(0) . Density at B will be

Pressure versus density graph of an ideal gas is shown in figure

Pressure versus temperature graph of an ideal gas as shown in Fig. Corresponding density (rho) versus volume (V) graph will be

Pressure versus temperature graph of an ideal gas as shown in Fig. Corresponding density (rho) versus volume (V) graph will be

Volume versus temperature graphs for a given mass of an ideal gas are shown in figure. At two different values of constant pressure. What can be inferred about relation between P_(1) and P_(2) ?

Volume versus temperature graphs for a given mass of an ideal gas are shown in figure. At two different values of constant pressure. What can be inferred about relation between P_(1) and P_(2) ?

Volume versus temperature graphs for a given mass of an ideal gas are shown in figure. At two different values of constant pressure. What can be inferred about relation between P_(1) and P_(2) ?

Pressure versus temperature graph of an ideal gas at constant volume V is shown by the straight line A. Now mass of the gas is doubled and the volume is halved, then the corresponding pressure versus temperature graph will be shown by the line

Temperature versus pressure graph of an ideal gas is shown in Fig. During the process AB

In figure shown,Pressure versus temperature graph of an ideal gas is as . Density of the gas at point A is rho_0 . Density at point B will be ____

ALLEN-GEOMETRICAL OPTICS-EXERCISE -01
  1. If the intermolecules forces vanish away, the volume occupied by the m...

    Text Solution

    |

  2. A refrigerator converts 100 g of water at 25^(@)C "into ice at" -10^(@...

    Text Solution

    |

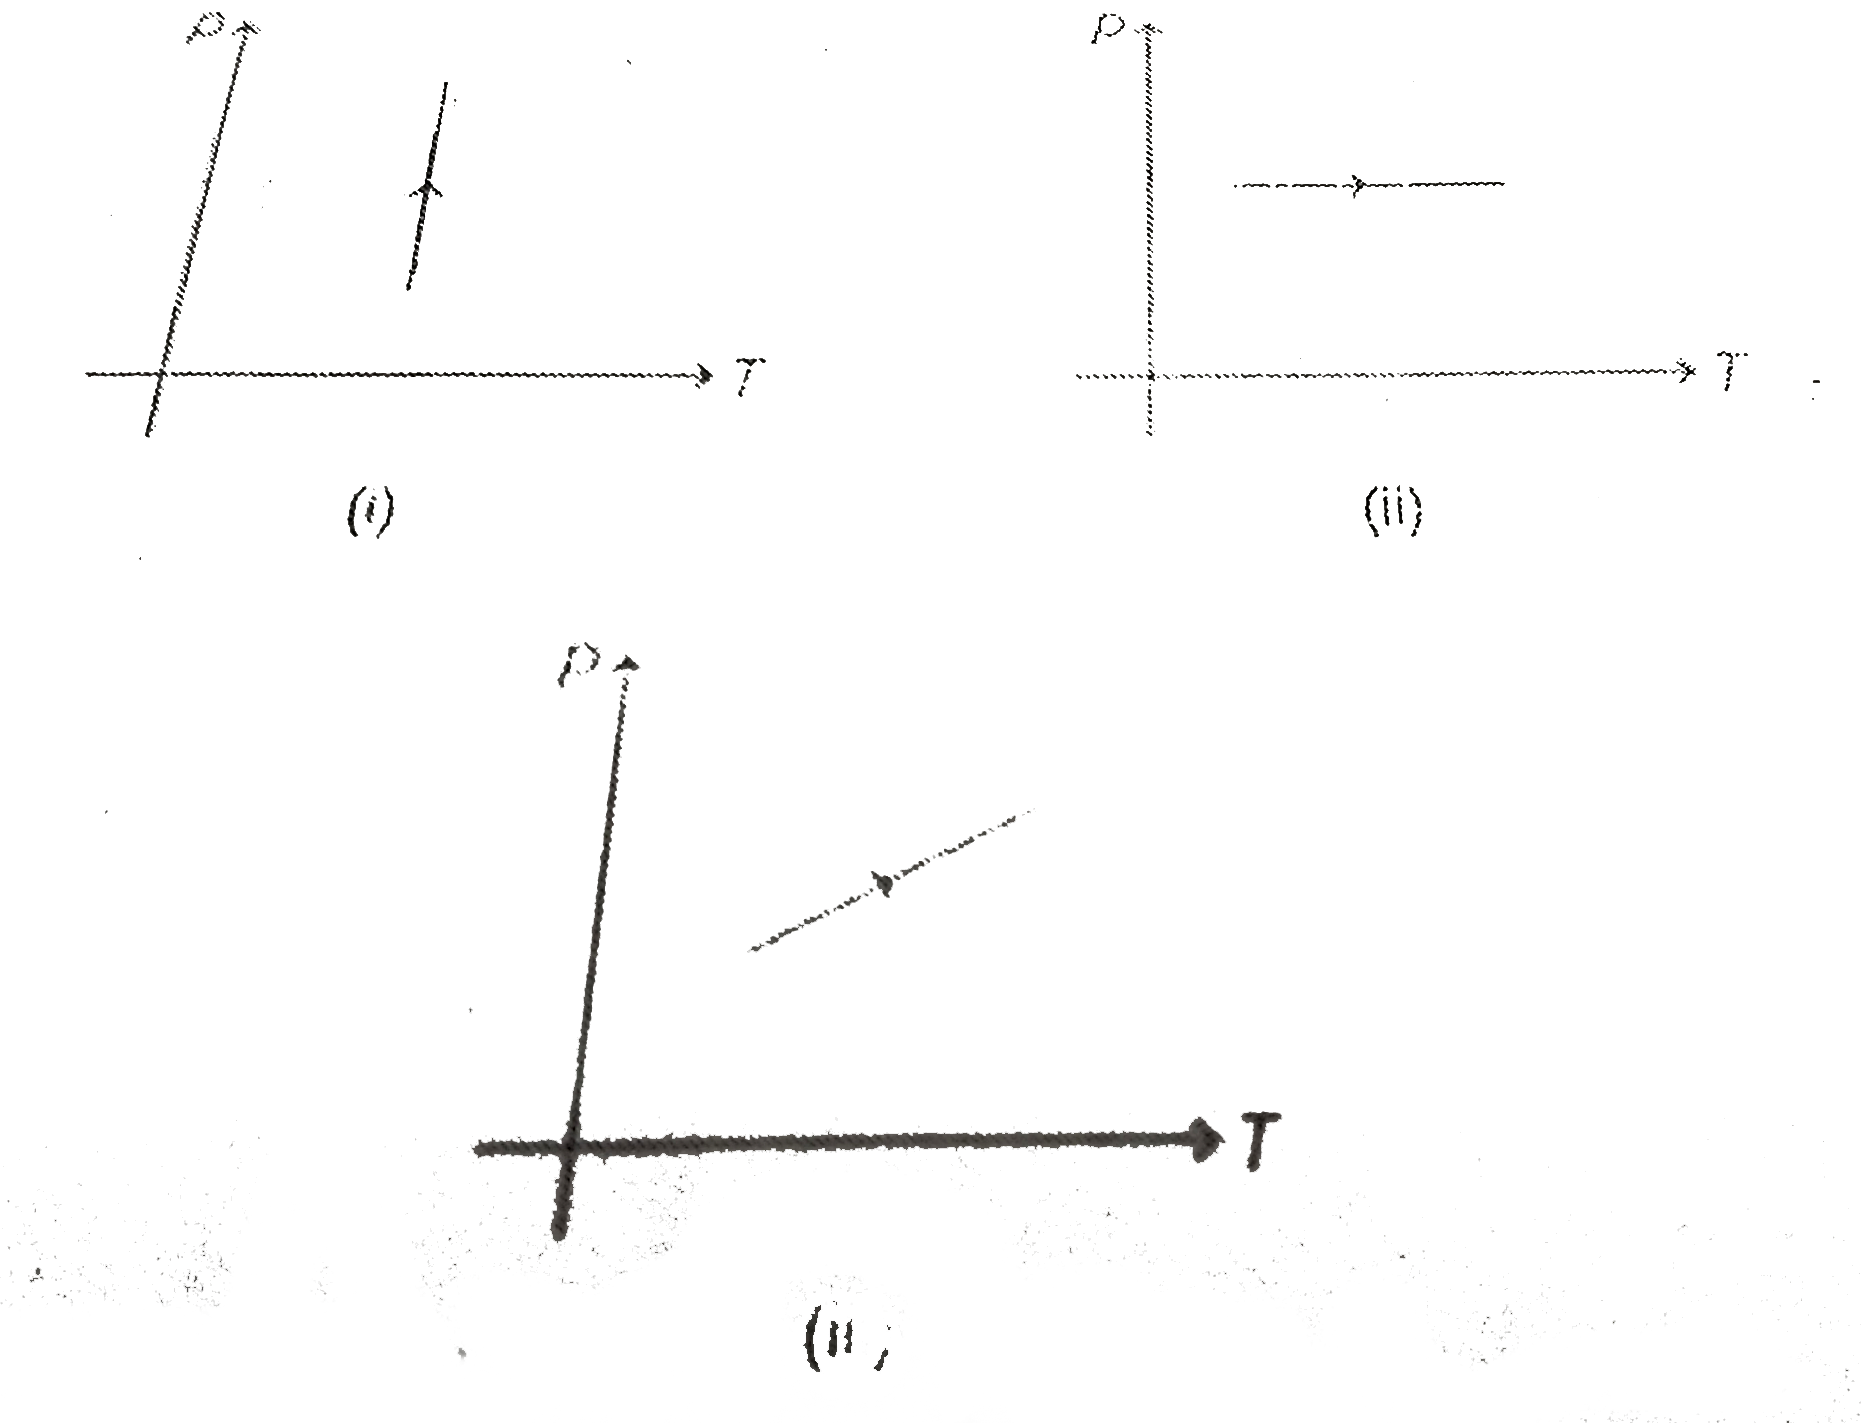
  3. Pressure versus temperature graphs of an ideal gas are as shown in fig...

    Text Solution

    |

  4. In a process the density of a gas remains constant. If the temperature...

    Text Solution

    |

  5. The expansion of unit mass of a perfect gas at constant pressure as sh...

    Text Solution

    |

  6. Air is filled at 60^(@)C in a vessel of open mouth. The vessel is heat...

    Text Solution

    |

  7. One mole of an ideal gas undergoes a process p=(p(0))/(1+((V(0))/(V))...

    Text Solution

    |

  8. Two identical glass bulbs are interconnected by a thin glass tube. A g...

    Text Solution

    |

  9. As shown , a piston chamber pf cross section area A is filled with ide...

    Text Solution

    |

  10. A gas has volume V and pressure p. The total translational kinetic ene...

    Text Solution

    |

  11. A mixture of n1 moles of diatomic gas and n2 moles of monatomic gas h...

    Text Solution

    |

  12. Four containers are filled with monoatomic ideal gases. For each conta...

    Text Solution

    |

  13. The mass of hydrogen molecule is 3.32xx10^(-27) kg. If 10^(23) hydroge...

    Text Solution

    |

  14. From the following V-T diagram we can conclude:-

    Text Solution

    |

  15. The density in grams per litre of ethylene (C(2)H(4)) at STP is :-

    Text Solution

    |

  16. A gas is expanded from volume V(0) to 2V(0) under three different proc...

    Text Solution

    |

  17. Some of the thermodynamic parameters are state variables while some ar...

    Text Solution

    |

  18. For an ideal gas PT^(11) = constant then volume expansion coefficient ...

    Text Solution

    |

  19. The internal energy of a gas is given by U= 5 + 2PV. It expands from V...

    Text Solution

    |

  20. When water is heated from 0^(@)C to 4^(@)C and C(P) and C(V) are its s...

    Text Solution

    |