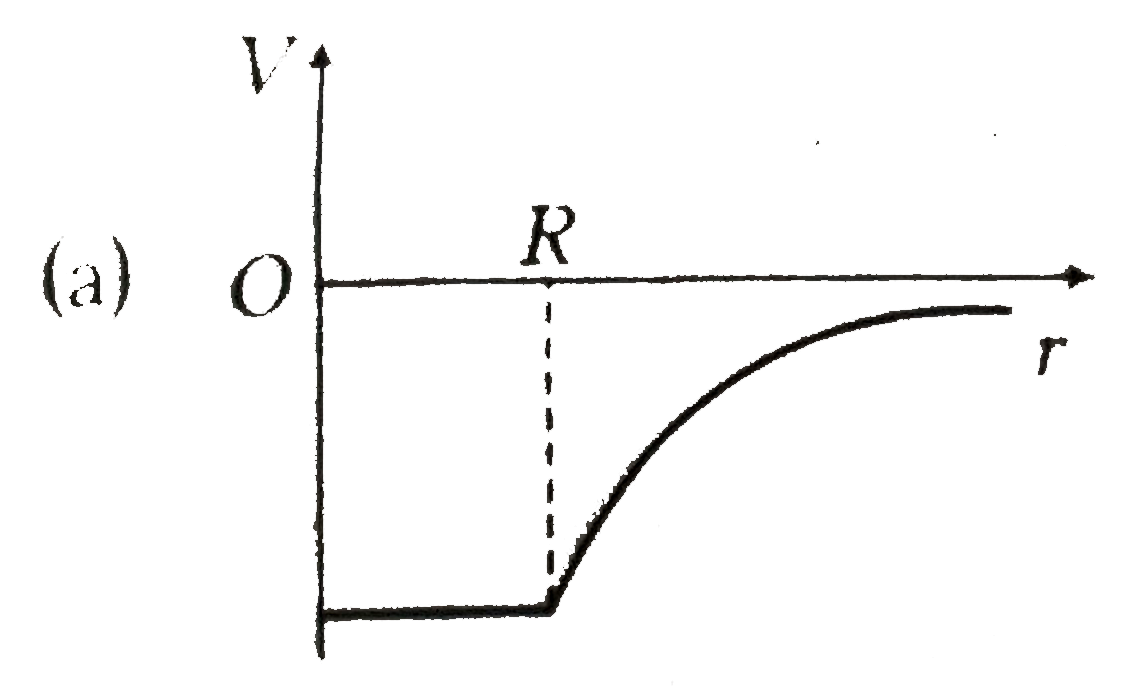
A
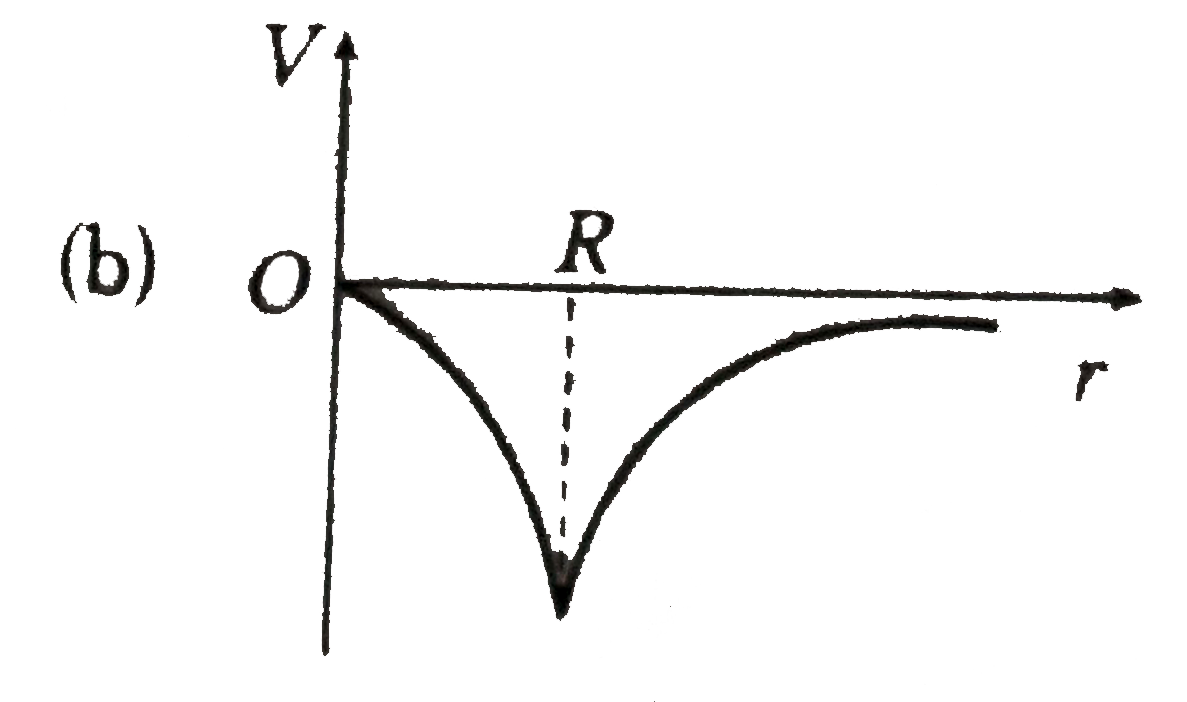
B
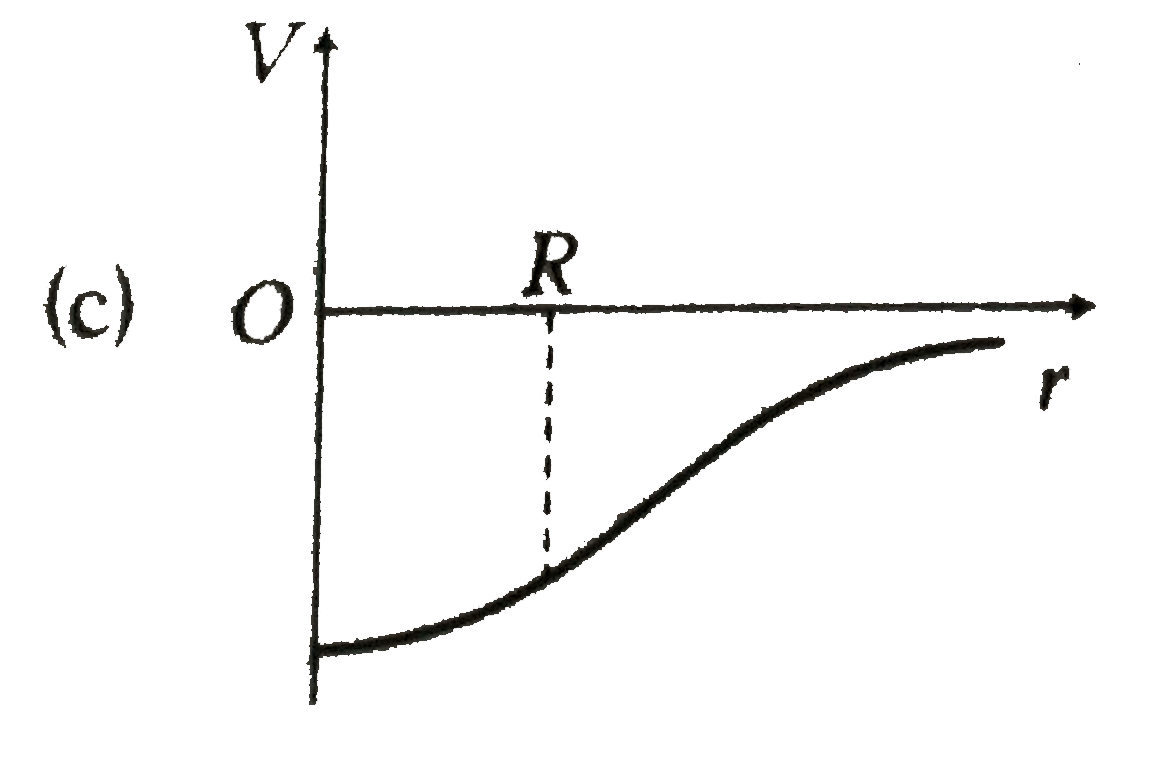
C
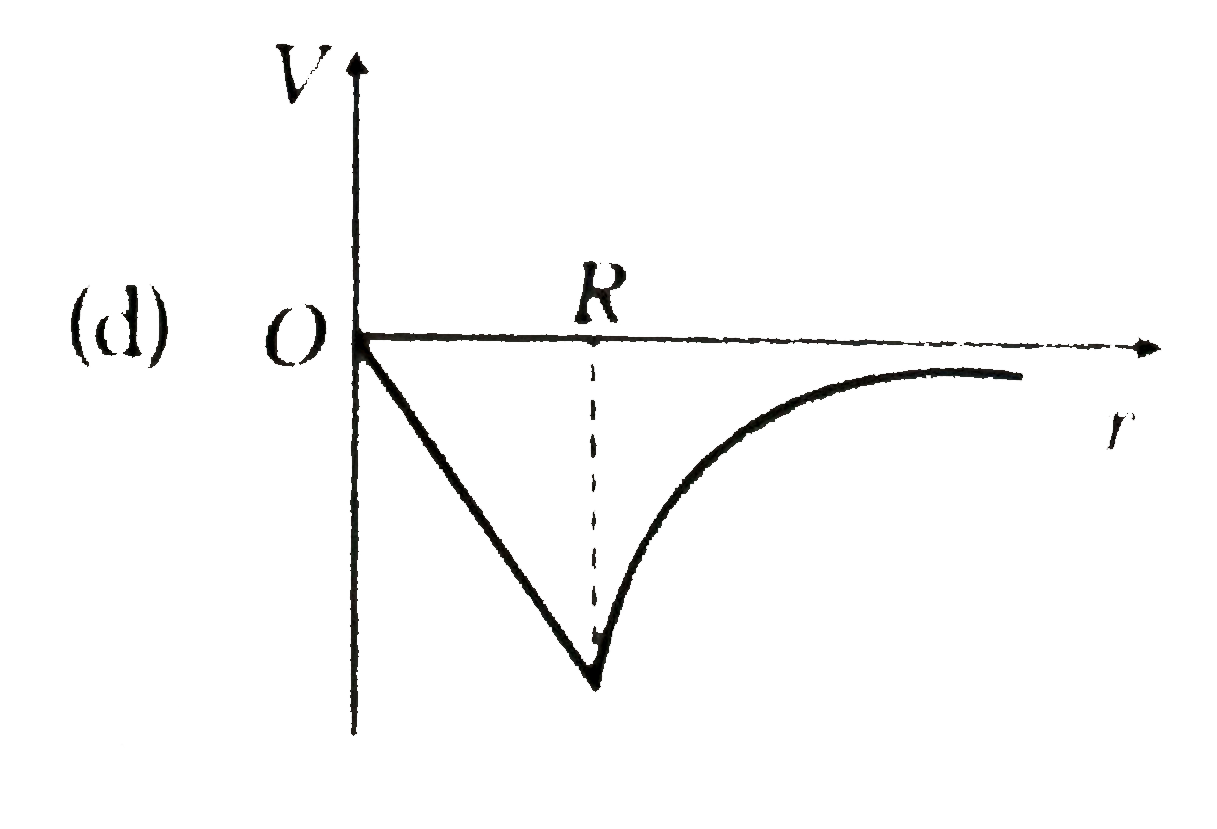
D
Text Solution
Verified by Experts
The correct Answer is:


Topper's Solved these Questions
Similar Questions
Explore conceptually related problems
DC PANDEY-GRAVITATION-Check Point 10.3
- Three particles each of mass m are kept at vertices of an equilateral ...
Text Solution
|
- At what height the gravitational field reduces by 75 % the gravitation...
Text Solution
|
- Gravitational field due to a solid sphere
Text Solution
|
- A mass m is placed inside a hollow sphere of mass M as shown in figure...
Text Solution
|
- A uniform solid sphere of mass m and radius r is suspended symmetrical...
Text Solution
|
- Which one of the following graphs represents correctly represent the v...
Text Solution
|
- Consider three concentric shells of masses M(1),M(2) and M(3) having r...
Text Solution
|
- Two bodies of masses m and M are placed at distance d apart. The gravi...
Text Solution
|
- A thin of length L is bent to form a semicircle. The mass of rod is M....
Text Solution
|
- A particle is kept on the surface of a uniform sphere of mass 100 kg a...
Text Solution
|
- The diagram showing the variation of gravitational potential of earth ...
Text Solution
|
- Inside a uniform shell
Text Solution
|
- If V is the gravitational potential on the surface of the earth, then ...
Text Solution
|
- By which curve will be variation of gravitational potential of a hollo...
Text Solution
|
- For a uniform ring of mass M and radius R at its centre
Text Solution
|