A
B
C
D
Text Solution
AI Generated Solution
The correct Answer is:


Topper's Solved these Questions
Similar Questions
Explore conceptually related problems
JEE MAINS PREVIOUS YEAR-JEE MAIN 2021-PHYSICS SECTION B
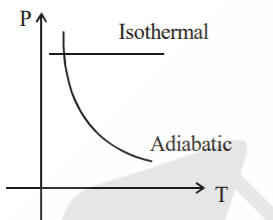
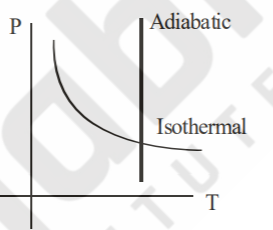
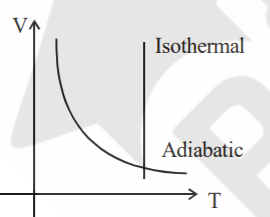
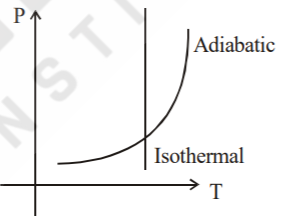
- Sample of gases are taken through isothermal and adiabatic process. Ch...
Text Solution
|
- A ball of mass 10 kg moving with a velocity 10sqrt3 m//s along the x-...
Text Solution
|
- As shown in the figure, a particle of mass 10 kg is placed at a point ...
Text Solution
|
- A particle performs simple harmonic motion with a period of 2 second. ...
Text Solution
|
- The voltage across the 10 resistor in the given circuit is x volt. ...
Text Solution
|
- A bullet of mass 0.1 kg is fired on a wooden block to pierce through i...
Text Solution
|
- Two separate wires A and B are stretched by 2 mm and 4 mm respectively...
Text Solution
|
- A parallel plate capacitor has plate area 100 m^2 and plate separation...
Text Solution
|
- The circuit shown in the figure consists of a charged capacitor of cap...
Text Solution
|
- An npn transistor operates as a common emitter amplifier with a power ...
Text Solution
|
- A person is swimming with a speed of 10 m/s at an angle of 120° with t...
Text Solution
|
- A body of mass 2 kg moves under a force of (2hati +3hatj +5hatk) N. It...
Text Solution
|
- A solid disc of radius 'a' and mass 'm' rolls down without slipping on...
Text Solution
|
- The energy dissipated by a resistor is 10 mj in 1 s when an electric c...
Text Solution
|
- For an ideal heat engine, the temperature of the source is 127^(@)C. I...
Text Solution
|
- In a parallel plate capacitor set up, the plate area of capacitor is 2...
Text Solution
|
- A deviation of 2^(@) is produced in the yellow ray when prism of crown...
Text Solution
|
- If one wants to remove all the mass of the earth to infinity in order ...
Text Solution
|
- A force vecF=4hati+3hatj+4hatk is applied on an intersection point of ...
Text Solution
|
- A closed organ pipe of length L and an open organ pipe contain gases o...
Text Solution
|
- A swimmer can swim with velocity of 12 km/h in still water. Water flow...
Text Solution
|